
What Payer CEO Pay Ratios Tell Healthcare CFOs About the Claims Environment They're Actually Navigating
The 206-to-748 gap is a structural map. Here's what it tells CFOs about denials, rate pressure, and the payer side of the table.
The Proxy Statements Just Dropped. Here's What Actually Matters.
The major health insurance proxy statements are filed, and the pay ratio headlines are already circulating. The range across the seven largest publicly traded payers runs from 206-to-1 at the low end to 748-to-1 at the top. The numbers are striking in isolation.
But this is not primarily a story about executive compensation. For healthcare CFOs on both sides of the payer-provider equation, the more useful question is what these ratios reveal about how payers are structured as businesses. And what that structure means for the claims environment you are navigating right now.
Yesterday I walked through the workforce cost challenge on the provider side, specifically why precision compensation beats flat-rate raises when margins are running at 2% to 3%. Today I want to flip the lens. Because while provider systems are trying to build smarter workforce strategies, many of their largest payer counterparties are running a fundamentally different organizational playbook. Understanding that playbook makes you a better negotiator, a better forecaster, and a better CFO.
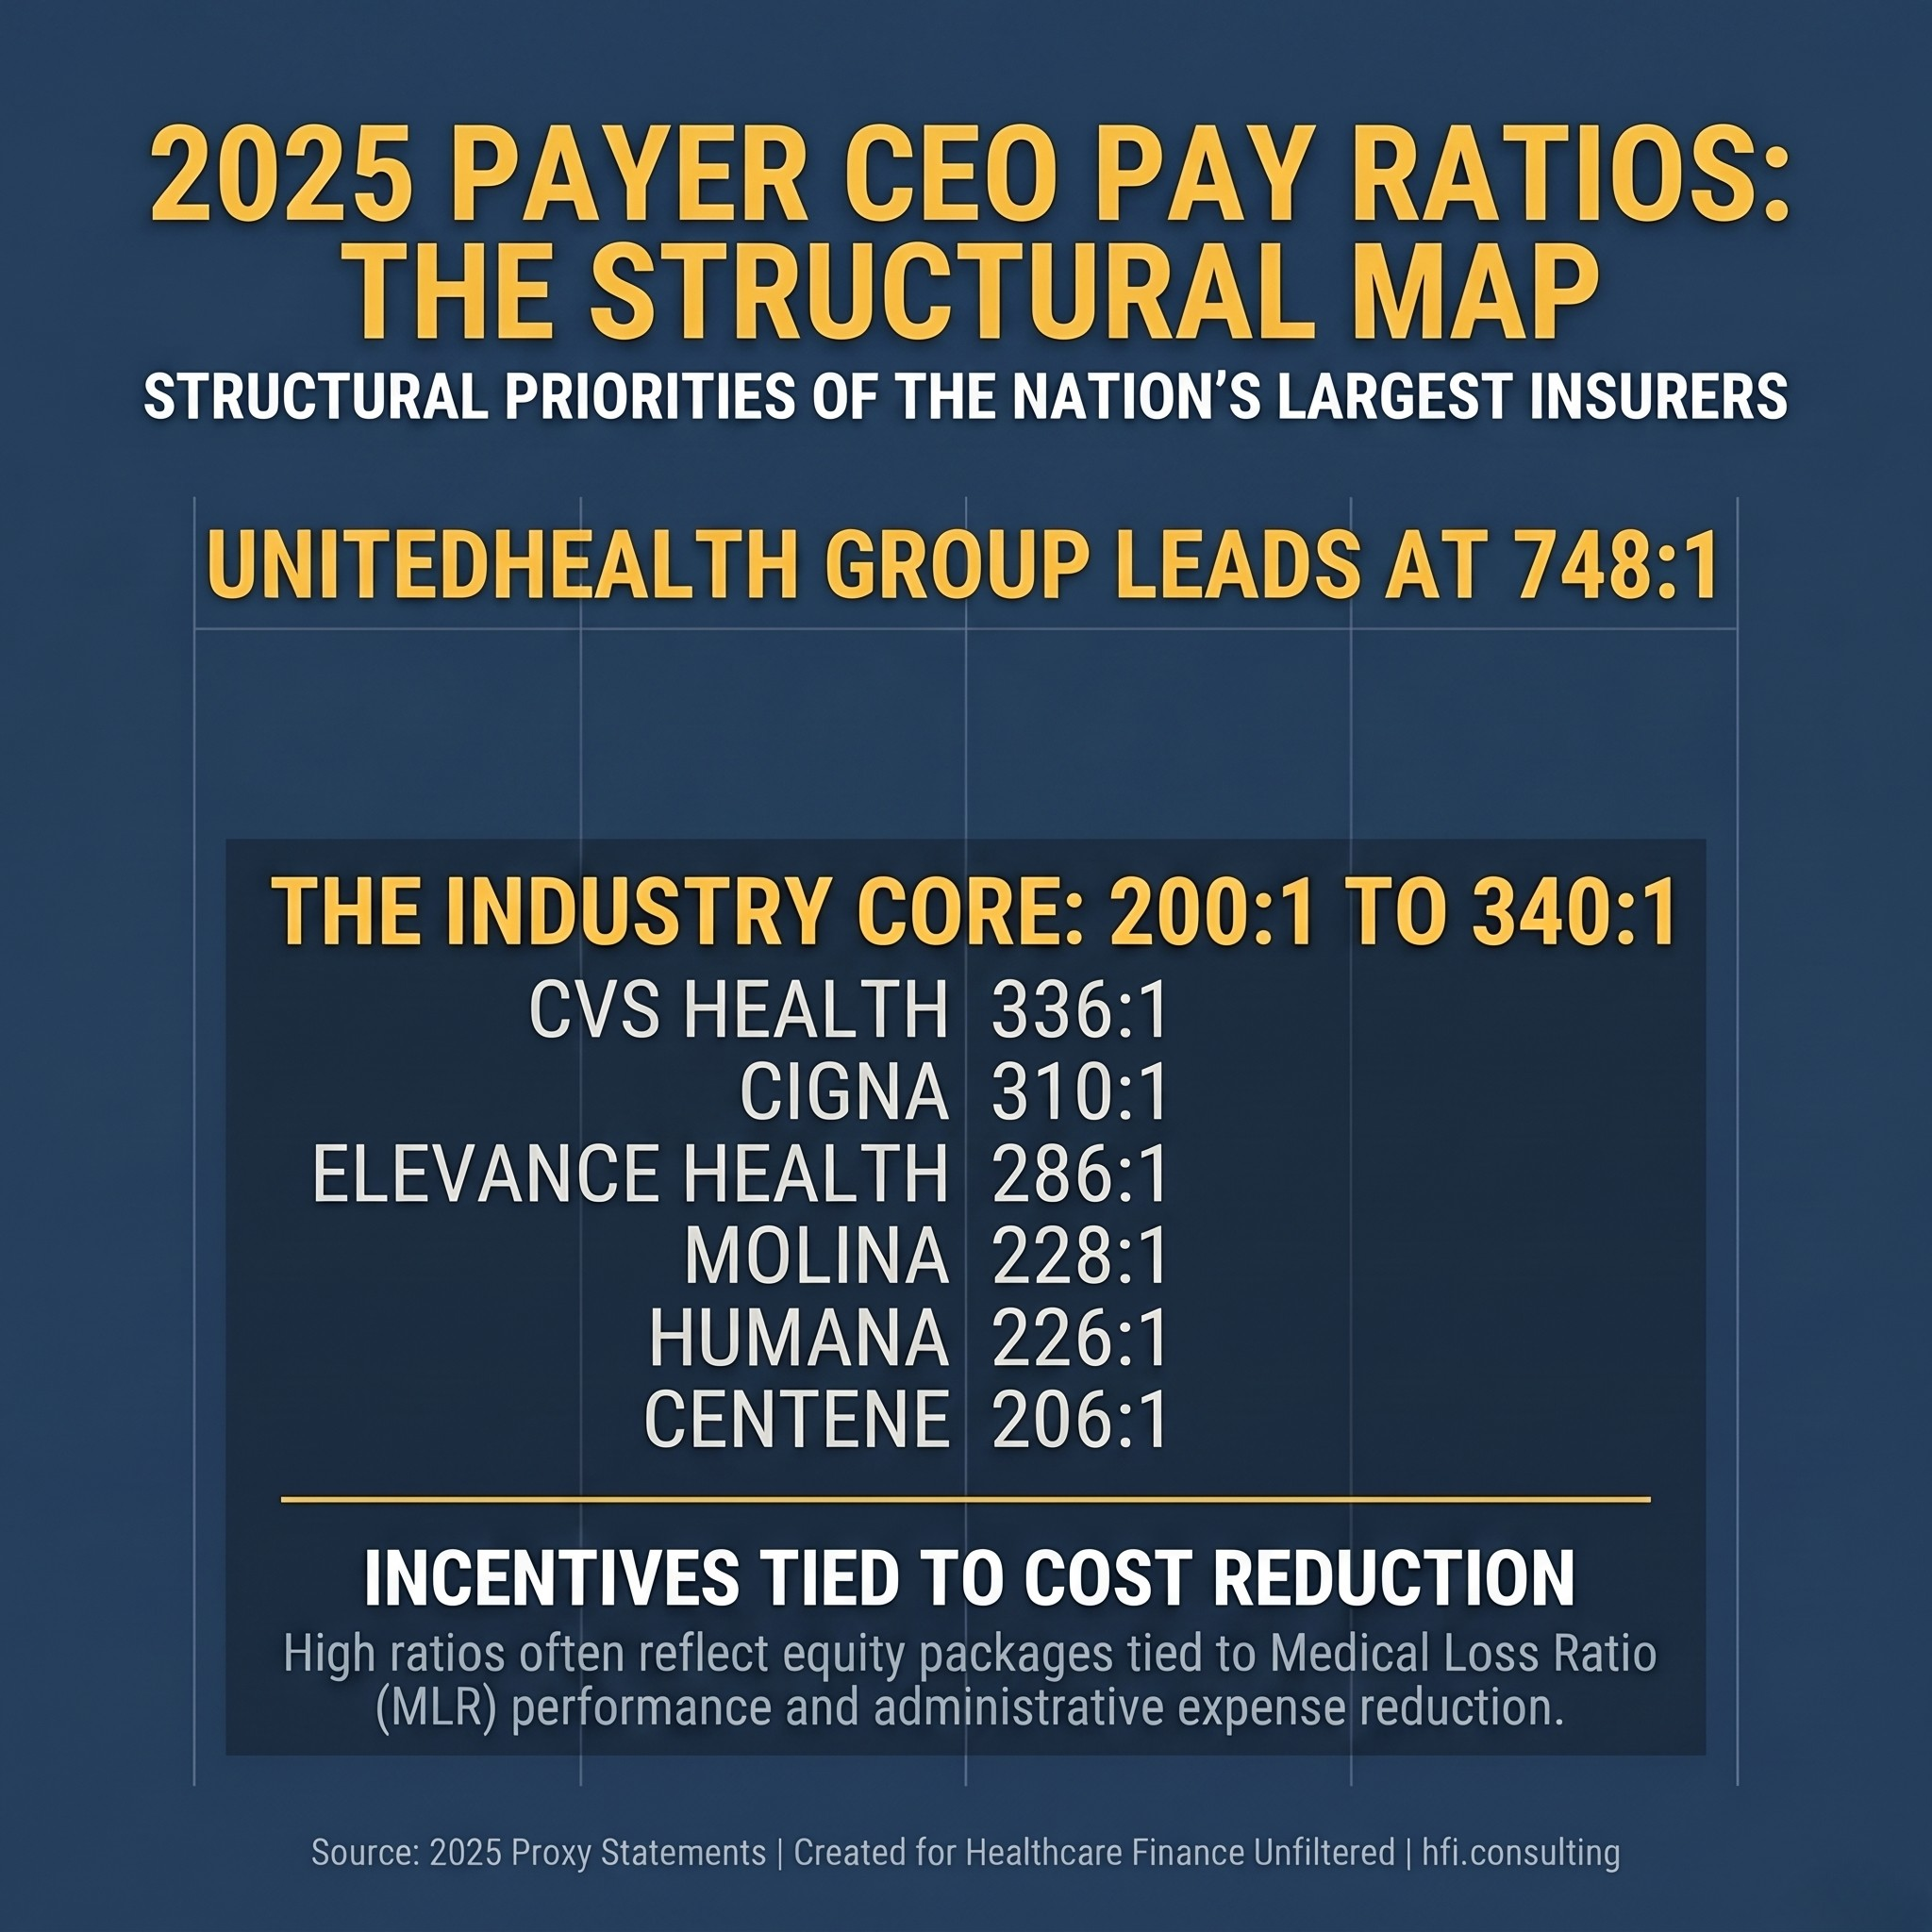
Stat card listing 2025 CEO-to-worker pay ratios for seven major health insurers, ranging from 206 to 1 at Centene to 748 to 1 at UnitedHealth Group.
How Boards Actually Justify These Numbers
Before analyzing the implications, it is worth presenting the corporate justification accurately. Boards and compensation committees are not cavalier about these packages. They construct a specific financial logic for them.
The first argument is capital stewardship. A CEO at a major national payer is not primarily a people manager in the traditional sense. The board views them as an asset manager responsible for deploying billions in premium revenue, managing reserve requirements, and making bets on risk pools that determine whether the plan makes or loses money on a population basis. A well-executed Medicare Advantage bid strategy across millions of members creates or destroys more value than virtually any other single decision the organization makes.
The second argument is pay structure. Proxy disclosures consistently note that 80% to 90% of total compensation for health insurance CEOs is not cash. It is performance stock units, options, and equity tied to specific financial metrics: revenue growth, operating margins, medical loss ratio performance, and total shareholder return. Boards argue this is not guaranteed money. If the company misses its targets, the CEO does not collect. That structure is real, and it matters for understanding what incentives are actually in play.
The third argument is scarcity. Boards convince themselves, often with compensation consultant support, that the pool of executives capable of navigating CMS regulatory complexity, state insurance commission requirements, risk-bearing provider networks, and public market expectations simultaneously is genuinely small. That narrative drives bidding wars between organizations and steadily inflates executive pay independent of what median workers earn.
All three of these justifications have real logic behind them. They are also worth understanding precisely because they explain behavior that directly affects your revenue cycle.
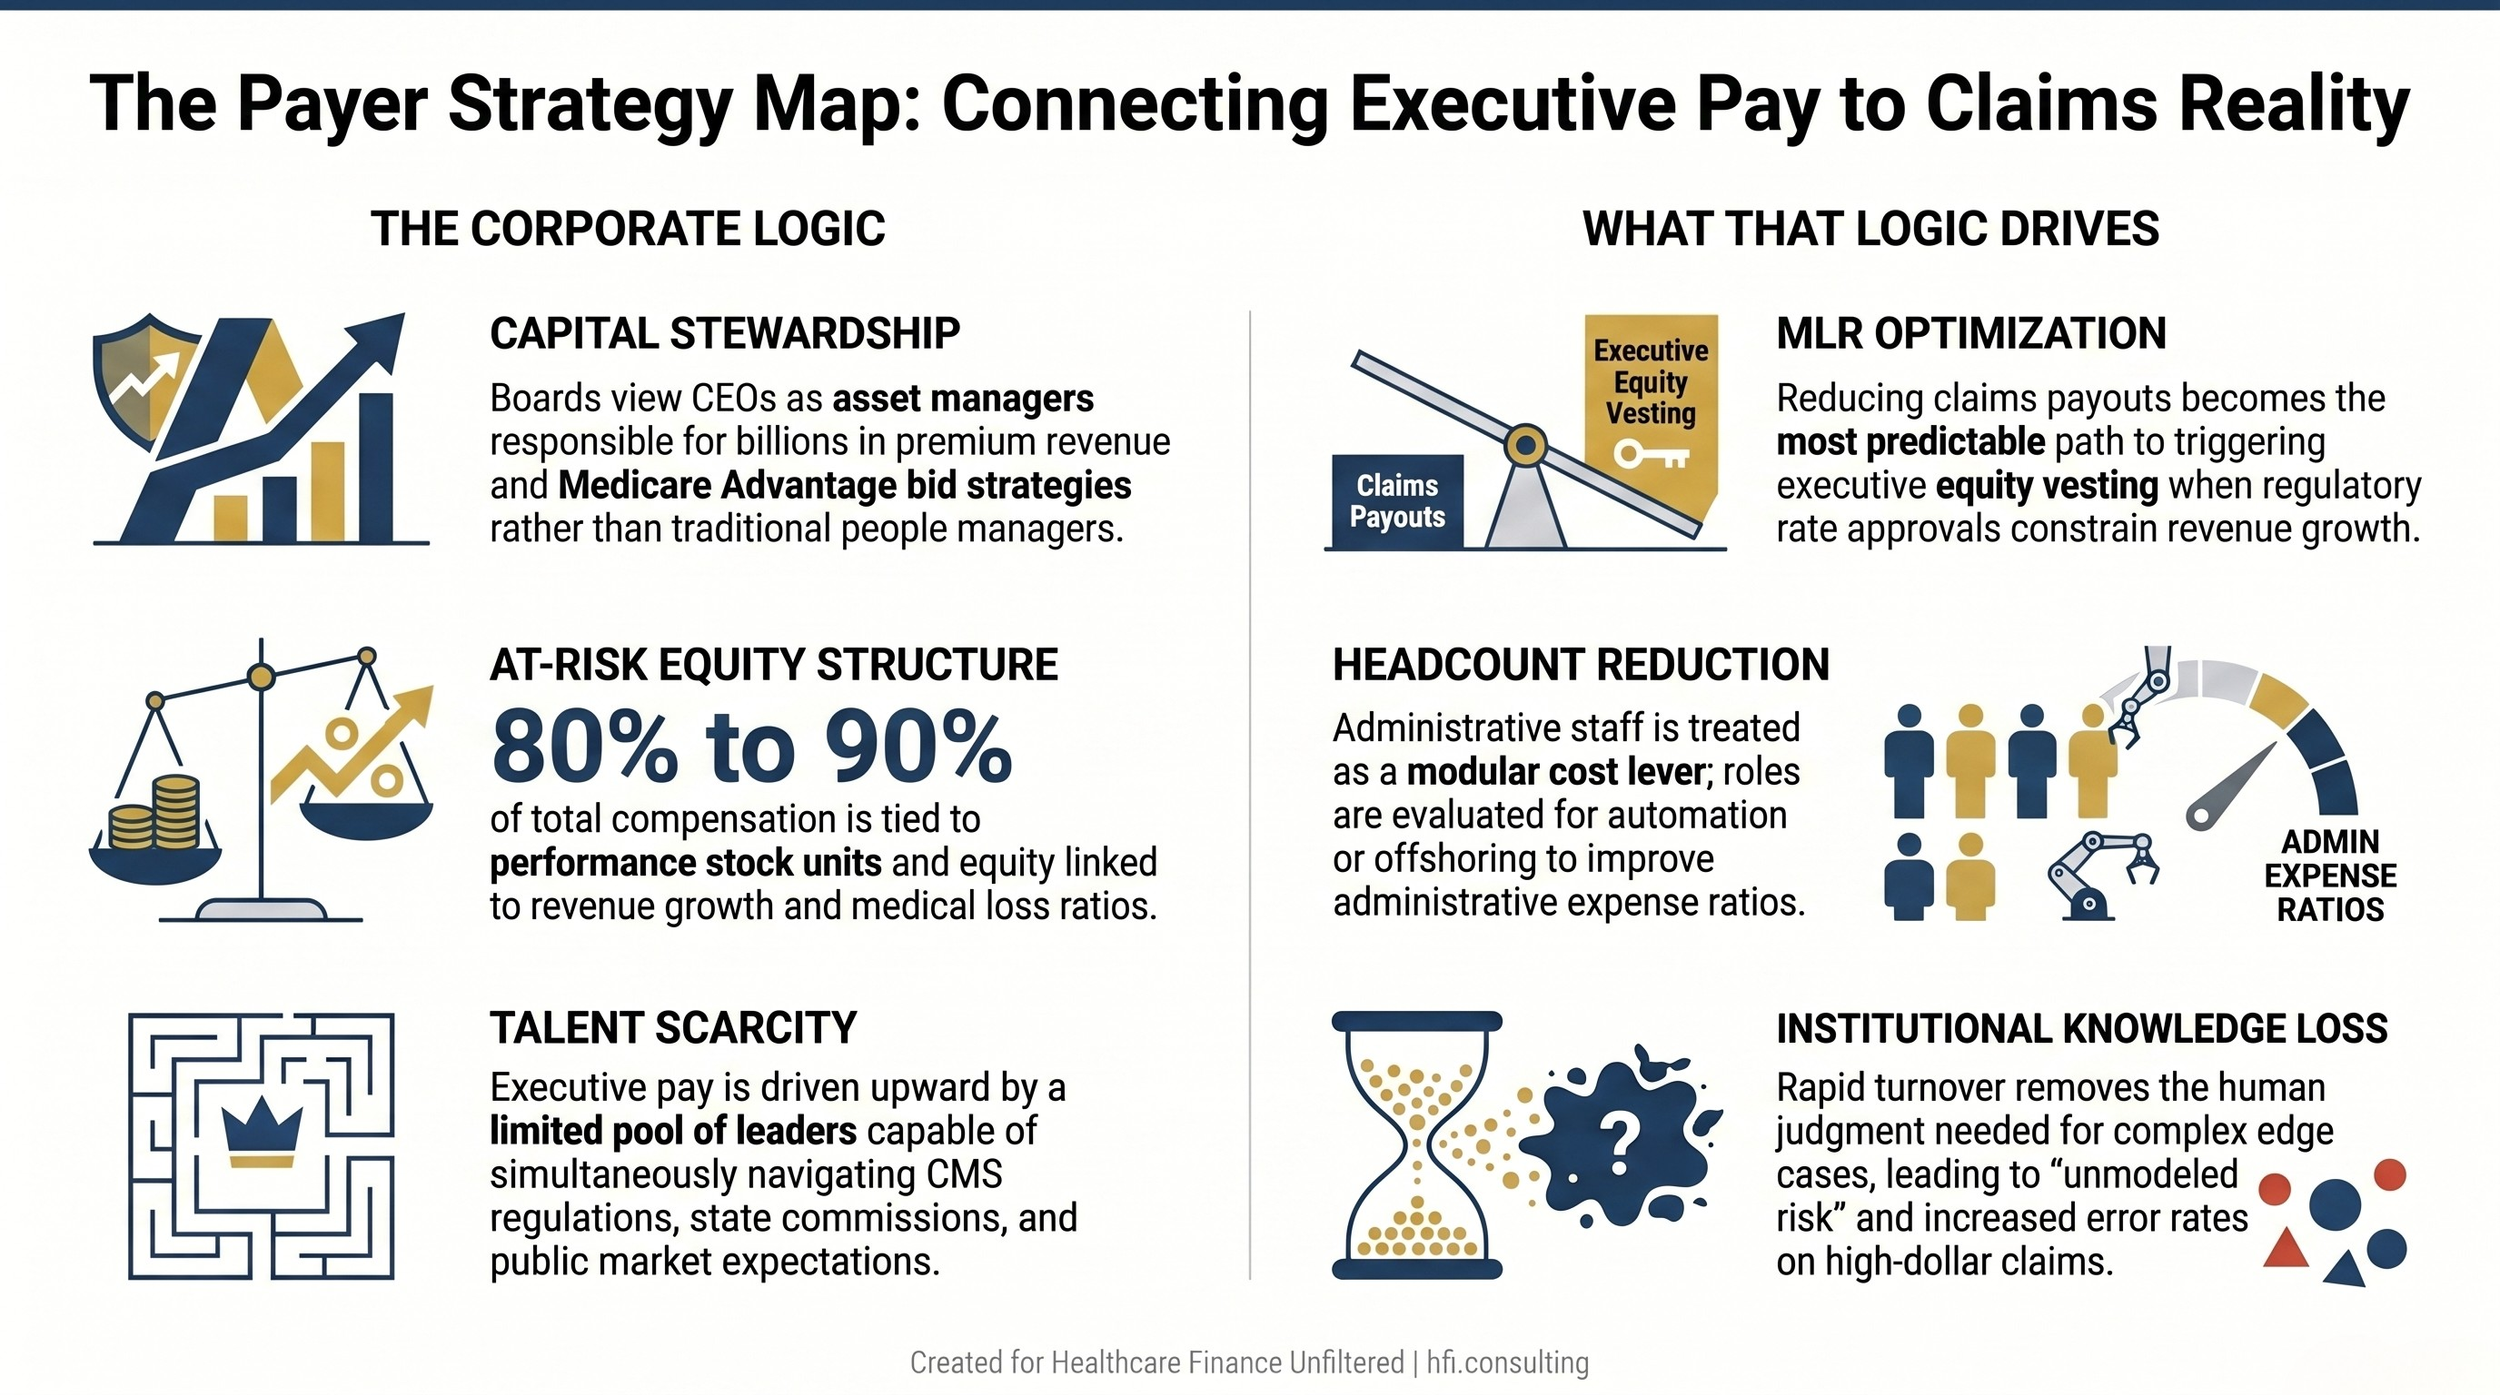
Two-column framework showing the corporate justification for payer executive pay and the operational outcomes that compensation structure creates.
When Executive Equity Is Tied to Cost Ratios, Watch the Levers They Pull
Here is the part that provider CFOs need to internalize.
When a significant portion of a CEO's equity vesting is tied to the medical loss ratio and the administrative expense ratio, cost reduction becomes the clearest and most predictable path to triggering that compensation. Revenue growth in insurance is constrained by regulatory rate approvals. Reducing what you pay out in claims and administrative overhead is more controllable.
The result is that payer administrative headcount is not evaluated primarily through the lens of service quality or operational capacity. It is evaluated through the lens of scalability and automation potential. Roles that can be documented into a standard operating procedure can theoretically be transitioned to a vendor, an offshore partner, or an automated workflow. The financial model treats these positions as modular. The operational reality, as anyone who has worked inside payer operations knows, is considerably more complicated.
When experienced claims processors leave, they take institutional knowledge with them. That knowledge includes things that were never in any SOP: the exception patterns that need human judgment, the provider relationships that smooth complex case escalations, the nuanced interpretation of clinical documentation that keeps adjudication accurate on high-dollar claims. None of that shows up on a cost-per-transaction report until it is already causing problems.
The headline version of this dynamic is the "survivor syndrome" that sets in after rounds of workforce reduction. Remaining staff absorbs the work of people who left. Processing timelines extend. Error rates on complex claims rise quietly. The kind of check-in question that starts with "how do you feel about the changes" lands differently on a team running 30% over capacity than it would in a stable operating environment.
For provider CFOs, that operational degradation shows up directly in your revenue cycle. The question is whether you know how to read it when it arrives.
What This Means If You Are on the Provider Side
I want to be precise here, because the instinct is to frame this as a coordination problem or an adversarial dynamic. It is more useful to frame it as an information problem.
When your denial rate ticks up in a specific category over a quarter, there are two very different explanations with very different strategic responses. The first is that the payer has made a deliberate policy decision to deny that category more aggressively. The second is that the team reviewing those claims has turned over, the institutional knowledge went with them, and the new reviewers are applying the rules more conservatively because they have not developed the judgment yet to recognize which edge cases warrant approval.
These two explanations require completely different responses. The first calls for a contract escalation and potentially a regulatory complaint. The second calls for better clinical documentation on your end and a targeted provider relations conversation focused on education rather than confrontation.
From my time in payer operations, I can tell you that providers who made the effort to understand what was actually happening on the other side of their claims consistently achieved better outcomes than those who defaulted to escalation on every denial. That operational intelligence is worth investing in.
For the formal framework on how both sides are paying for the denial cycle, including what the administrative burden actually costs each side, see The Denial Loop Is Breaking Healthcare: What Both Sides Are Paying and What Has to Change.
The technology piece is also relevant here. If your payer counterpart is running algorithmic denial generation while your team is still working manual appeals, that asymmetry has a quantifiable dollar value. That is the argument I made in AI in the Revenue Cycle: How Hospitals Are Fighting Back Against Payer Take-Backs. The strategic response is not just to appeal more aggressively but to match the analytical sophistication of the entity you are appealing against.
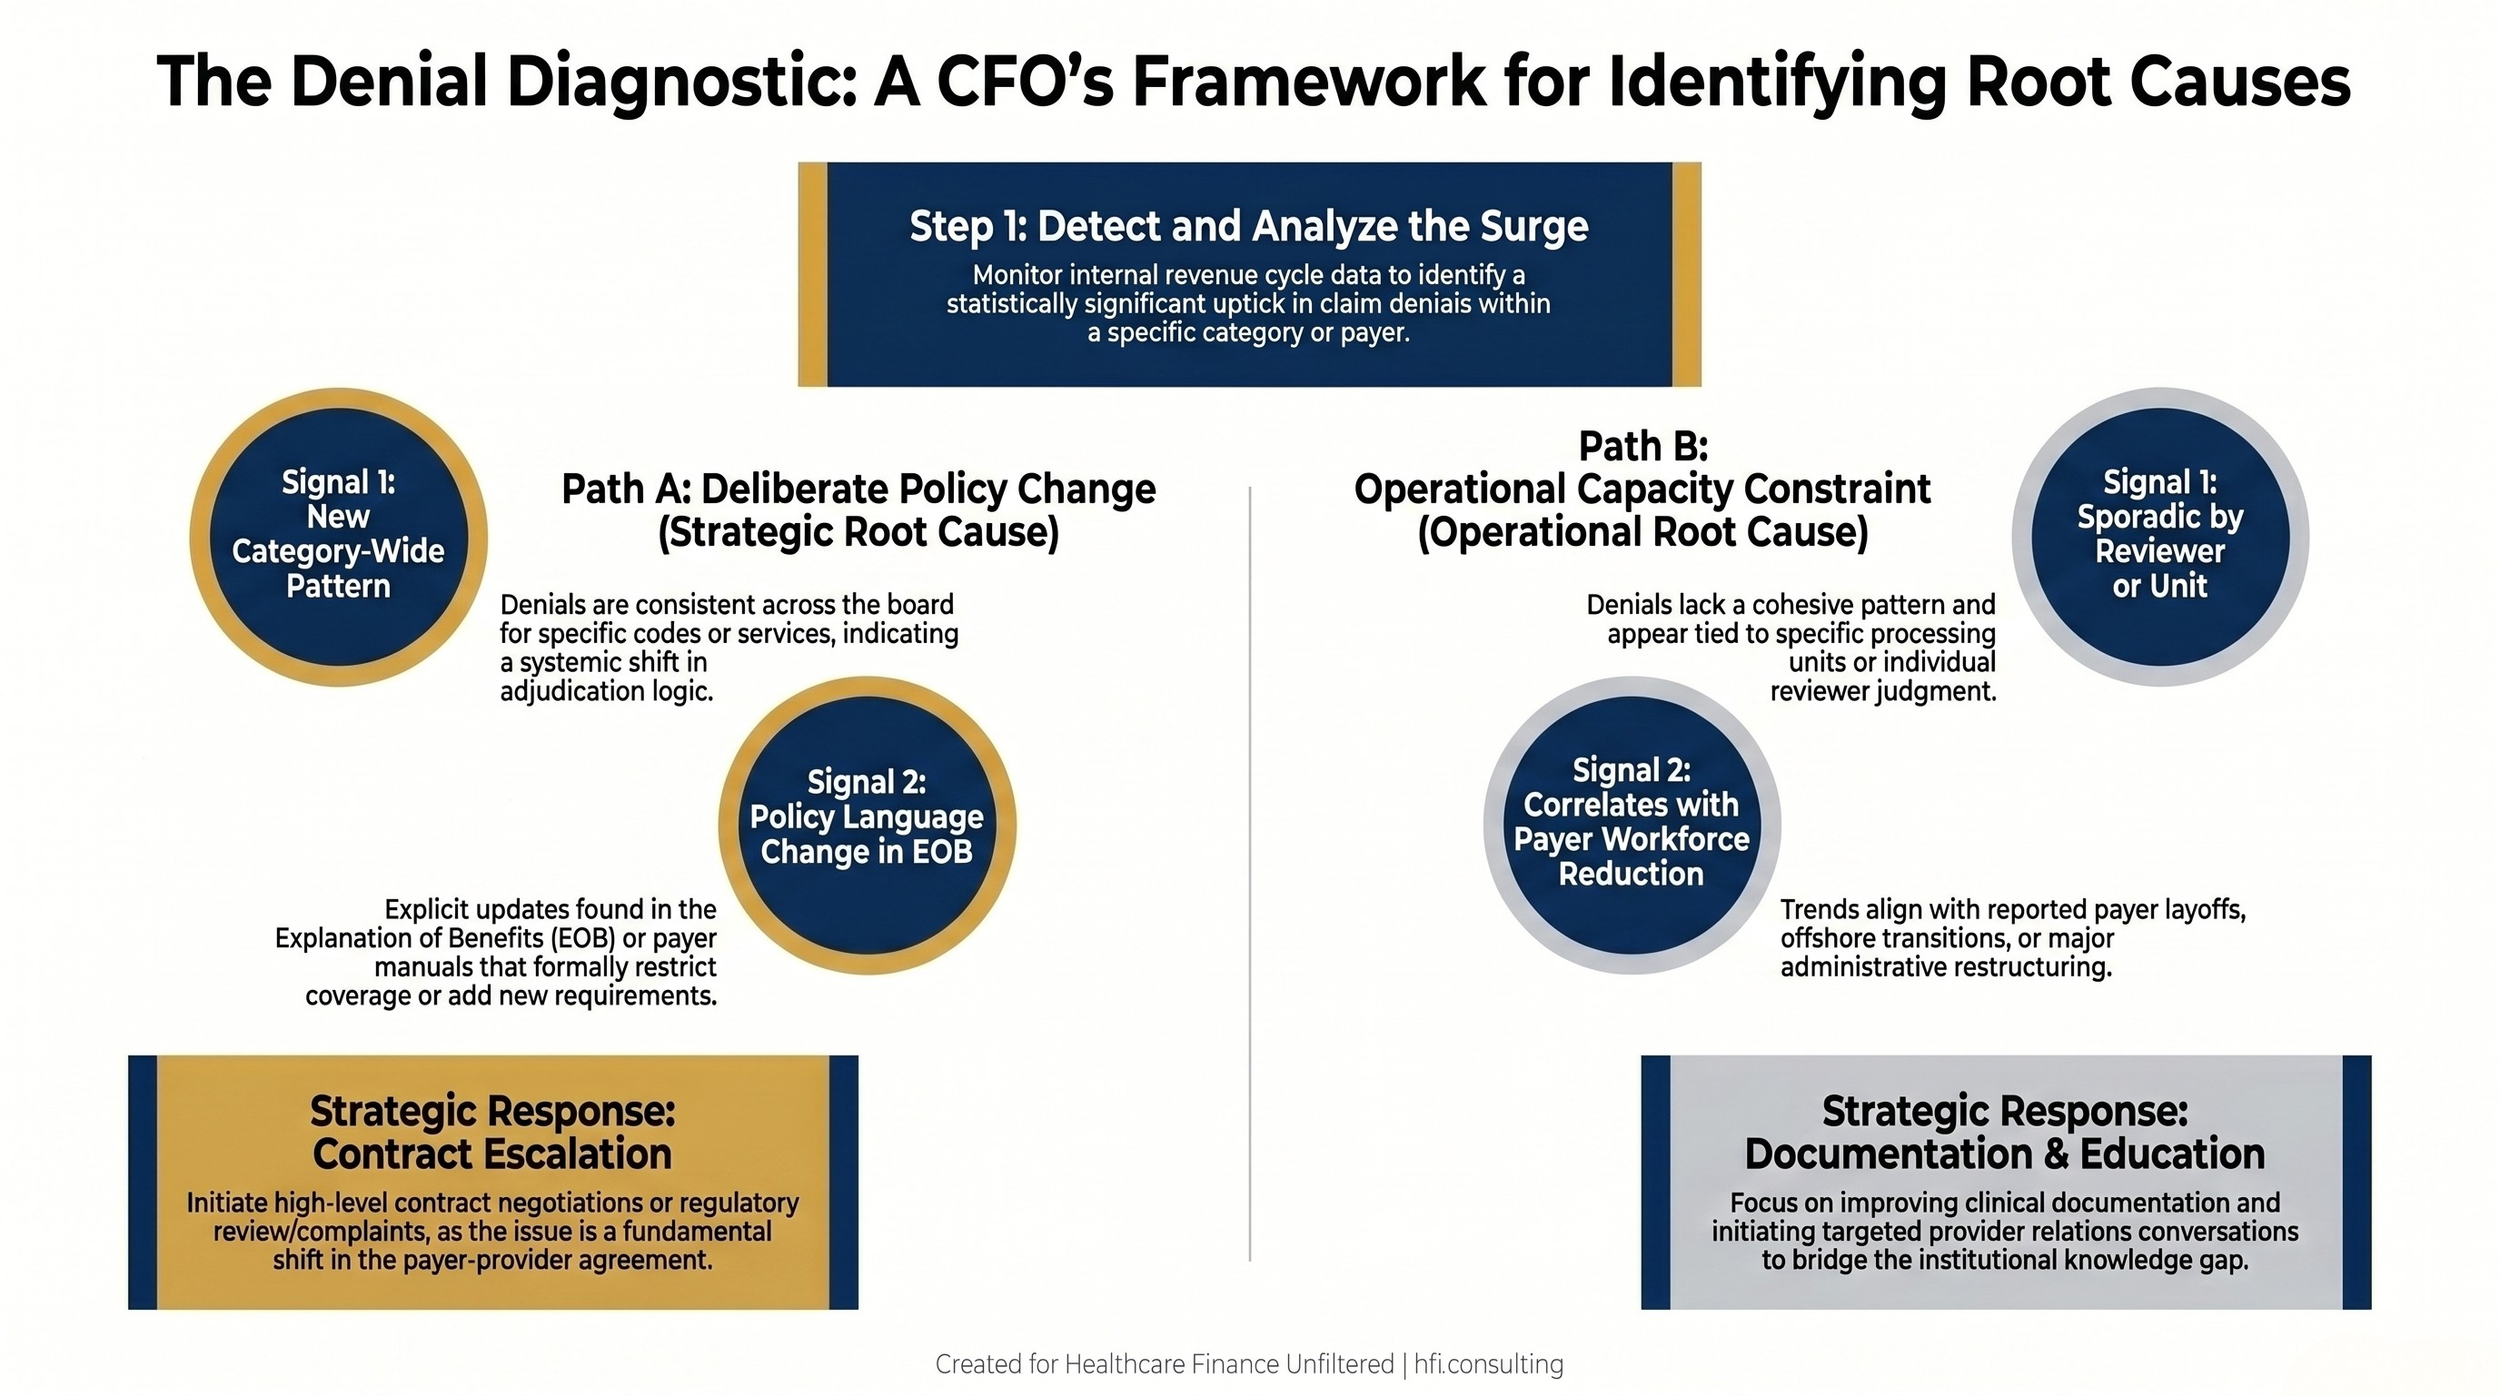
Decision flow diagram showing how to distinguish between deliberate payer policy denials and operational capacity-driven denials, with corresponding response strategies for each path.
If your team is losing ground on payer disputes and you are not sure whether you are fighting a policy problem or an operational one, that distinction is worth getting right before you escalate. The provider contract strategy framework and denial diagnostic are at hfi.consulting
What This Means If You Are on the Payer Side
The workforce reduction math looks clean on a cost-per-transaction basis right up until it does not. The risk is not visible on a quarterly cost report. It lives in the claims that are processed incorrectly, the escalations that do not get caught before they become complaints, and the provider relationship damage that takes years to repair after a period of poor adjudication quality.
For payer CFOs, the operational question is where the threshold is between efficiency gains and capability degradation. That threshold is different for every function. Claims processing for routine medical claims has a high automation ceiling. Prior authorization review for complex clinical cases has a much lower one. The mistake is applying the same reduction logic across both categories because they both appear as administrative headcount on the cost report.
The proxy data also creates a specific internal morale challenge that deserves honest acknowledgment. When the CEO pay ratio becomes public and employees are calculating what that number means relative to their own compensation, the "how do you feel about the changes" conversation becomes a very different kind of exercise. That is not a communications problem that better messaging solves. It is a structural tension that finance and HR leadership need to model explicitly in their retention risk forecasts.
The workforce-level implications on the payer side mirror the provider-side challenges I covered yesterday, just with a different organizational structure and regulatory context. Flat-percentage raises applied uniformly across payer operations create the same misallocation problem on the payer side that they create on the provider side. The roles carrying the highest operational risk when they go vacant are not necessarily the ones with the highest base pay.
For a closer look at what payer-side restructuring means for the finance leaders navigating those transitions, see Revenue Cycle Leadership Transitions: The Payer Restructuring Moment That Reframes Your First 90 Days.
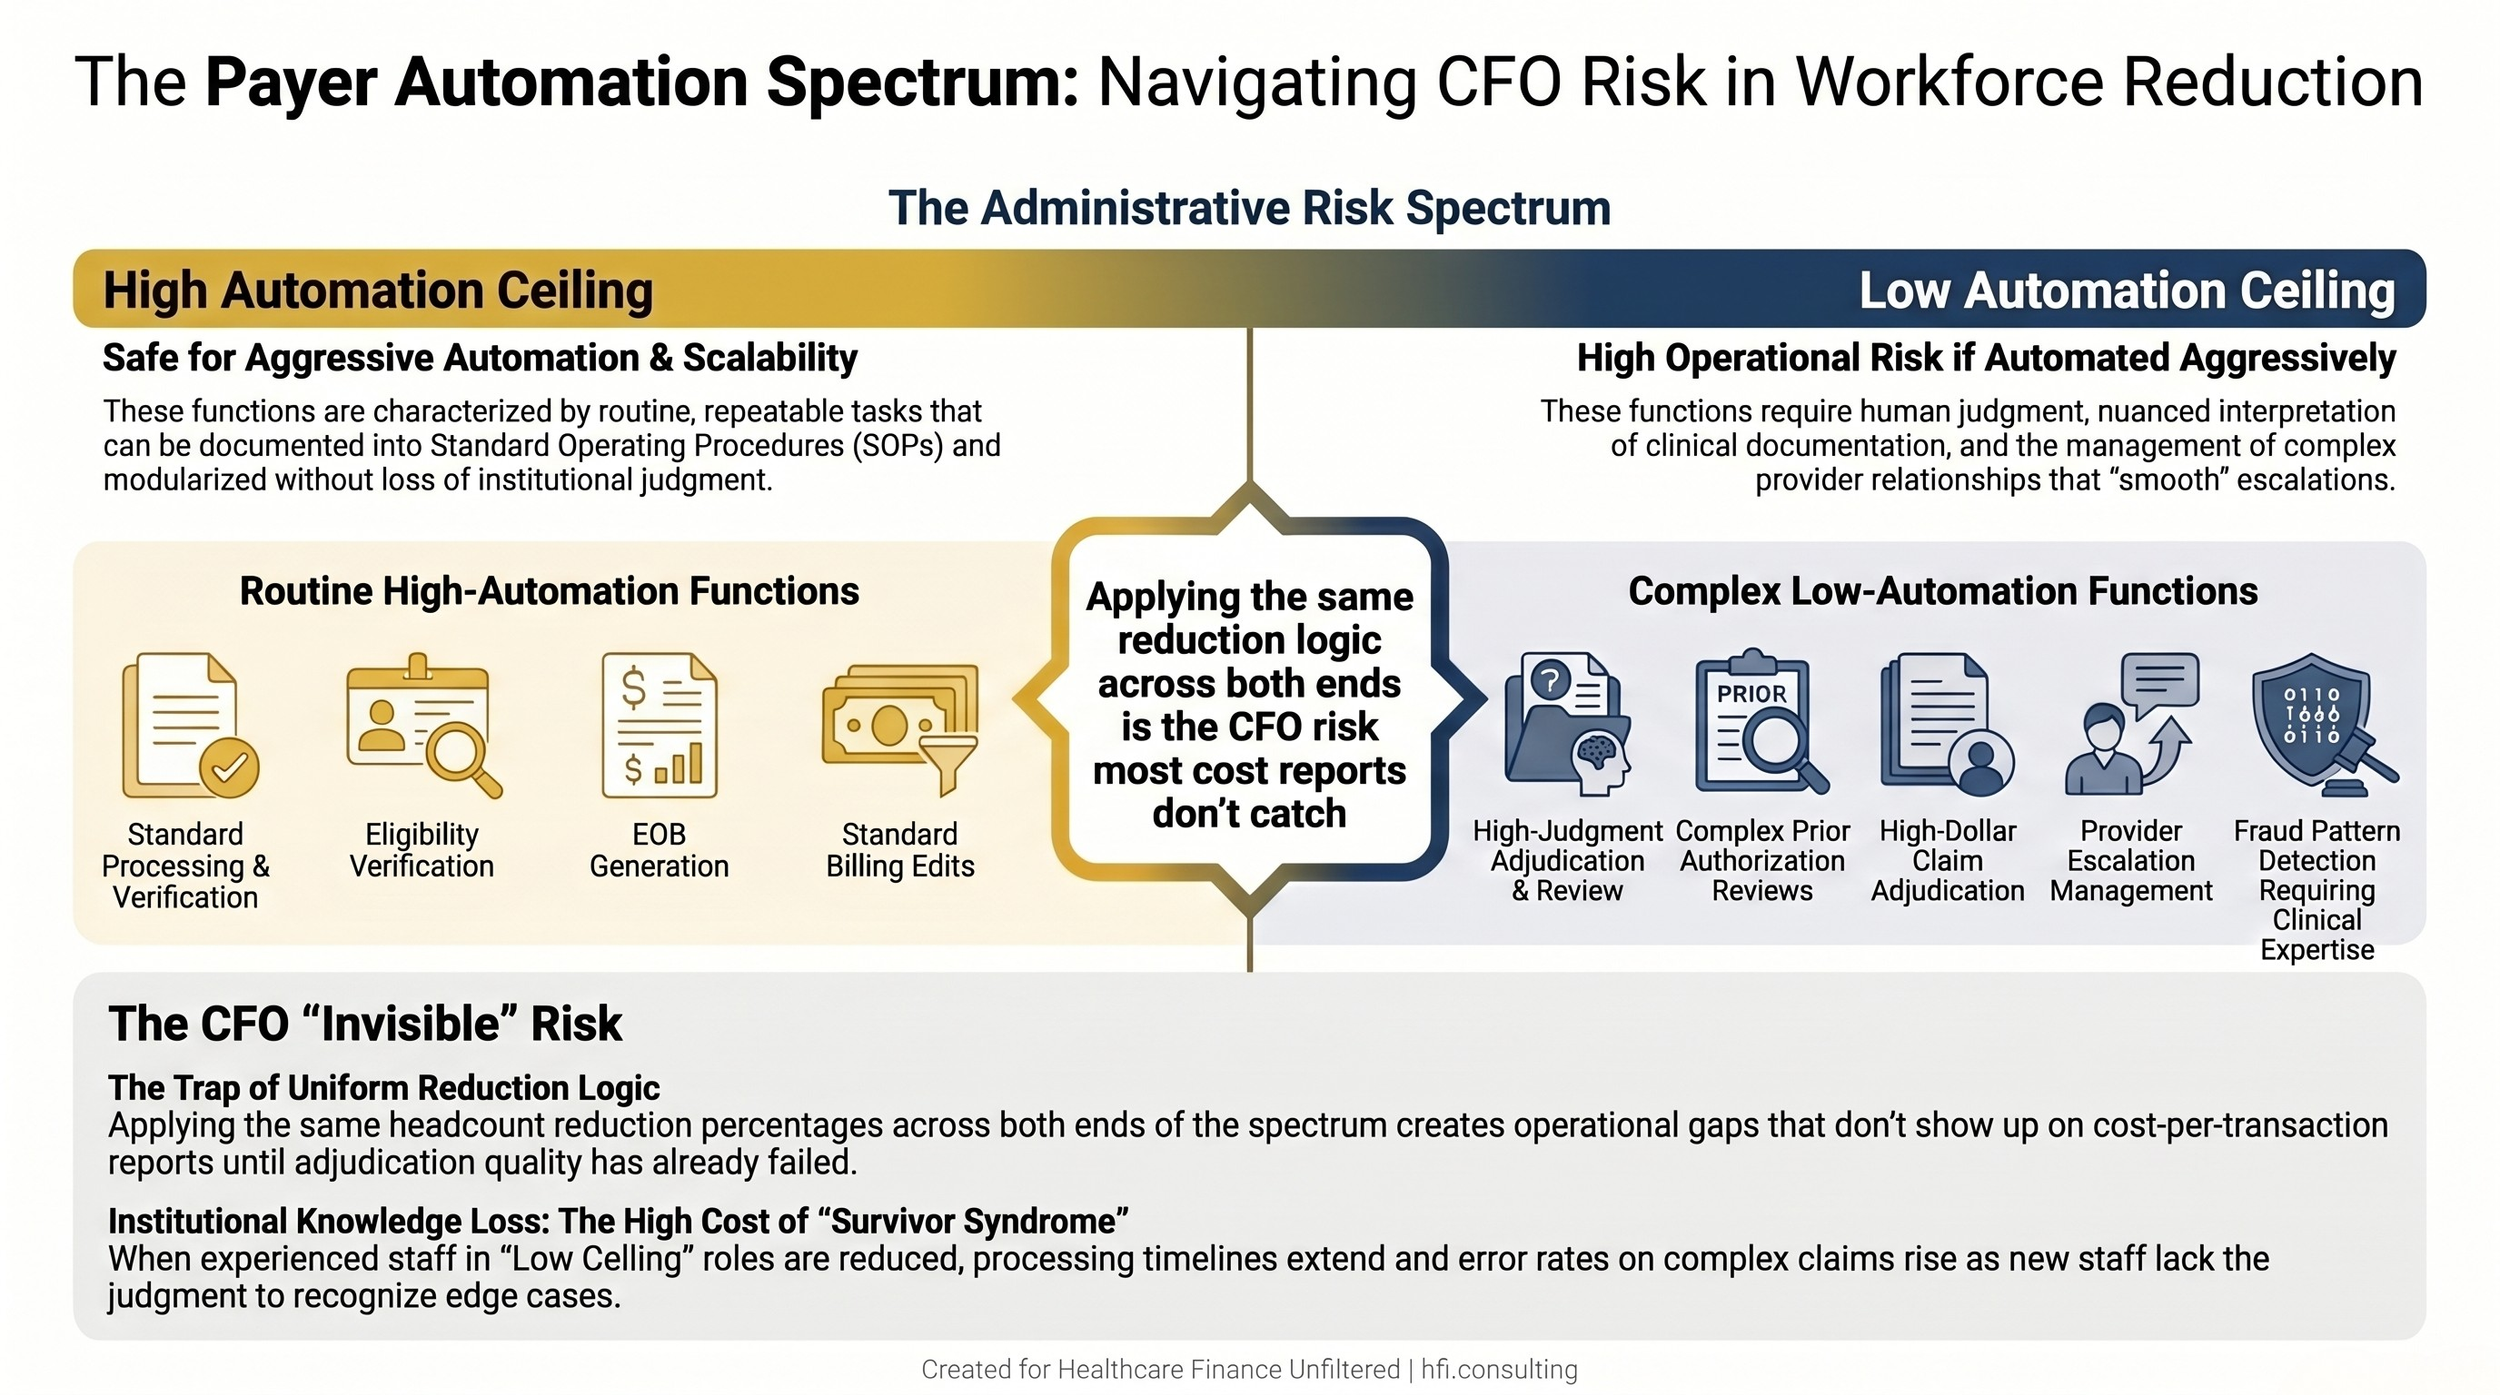
Risk spectrum showing payer administrative functions ranked from high automation ceiling on the left to low automation ceiling on the right, highlighting where workforce cuts create operational degradation risk.
The Broader Context Neither Side Can Ignore
The cost blame game in healthcare is well documented. Providers point to payer administrative burden and rate pressure. Payers point to provider price inflation and utilization growth. Congress gets testimony from both sides and produces data that validates both narratives simultaneously.
I covered that dynamic in detail in Hospital Price Inflation vs. Insurer Margins: What the 2026 Cost Blame Game Means for Healthcare CFOs. The short version is that both sides have accurate grievances and neither side's argument fully accounts for the structural dynamics that make the system expensive.
The CEO pay ratios add one more layer to that picture. The incentive structures that govern executive compensation at publicly traded payers are pulling in a direction that optimizes for shareholder value through cost management. The incentive structures that govern hospital and health system executive compensation are increasingly pulling toward operational scale and efficiency. These are not the same objective, and in many cases they are directly in conflict.
That conflict does not have a policy resolution available in the near term. What does exist is operational intelligence. Finance leaders on both sides who understand the structural incentives their counterparts are responding to negotiate more precisely, set more realistic expectations, and make better decisions under regulatory uncertainty.
The Questions Worth Asking Before Your Next Payer Contract Negotiation
If you are a provider CFO, three questions are worth answering before your next managed care renewal:
What has happened to the payer's administrative headcount in the past 18 months in the functions that touch your claims? The answer is often available through industry reporting, and it is a meaningful predictor of claims processing quality in the next contract cycle.
How much of your current denial volume is category-consistent across all payers versus concentrated in a specific payer relationship? That pattern tells you whether you are dealing with a policy shift, an operational failure, or a documentation gap on your end.
Is your managed care contracting team equipped to present clinical documentation data alongside financial data when negotiating rates? Payers respond to evidence that your population costs them less to manage. That is the argument worth making at the table.
If you are navigating a complex payer contract negotiation or working through a denial trend that does not have a clean explanation, the payer contract and revenue cycle framework is something I work through with finance leadership teams directly. Connect at hfi.consulting
The Bottom Line
The proxy statement data is worth understanding, but not as a scorecard of who wins and who loses. It is more useful as a structural map of how the organizations sitting across from you in contract negotiations are actually managed, what their boards are measuring, and why the decisions that affect your revenue cycle look the way they do.
Both sides of this equation are under real financial pressure. Payer margins are not as comfortable as the CEO pay packages suggest. Provider margins are not as fragile as the advocacy narratives suggest. What both sides share is a claims environment that has become administratively expensive for everyone, and a set of structural incentives that currently reward optimization over coordination.
Finance leaders who understand that landscape operate with more clarity. That is the work worth doing.
P.S. If you are a payer-side finance leader, I am genuinely curious: where do you see the operational risk threshold in your admin workforce? The point where the efficiency model starts creating exposure rather than reducing it. Hit reply and tell me what you are actually navigating.