
Hospital Price Inflation vs. Insurer Margins: What the 2026 Cost Blame Game Means for Healthcare CFOs
Both sides have valid data. Here is the financial architecture CFOs on either side of the ledger need to understand.
A House Ways and Means Committee hearing this week produced something rare in Washington: bipartisan agreement. Lawmakers from both parties called hospital prices "borderline extortionary" and cited Bureau of Labor Statistics data showing hospital costs have risen 281% since 2000, roughly triple overall inflation. AHIP published supporting analysis the same week. The payer industry's case against provider pricing has never been better documented.
It is also strategically incomplete.
The payer vs. provider affordability debate has been running for decades, and it never resolves because both sides are simultaneously correct about the other and selectively silent about themselves. If you lead finance for a health system, a physician group, or a health plan, you do not have the luxury of picking a side. You need the full ledger.
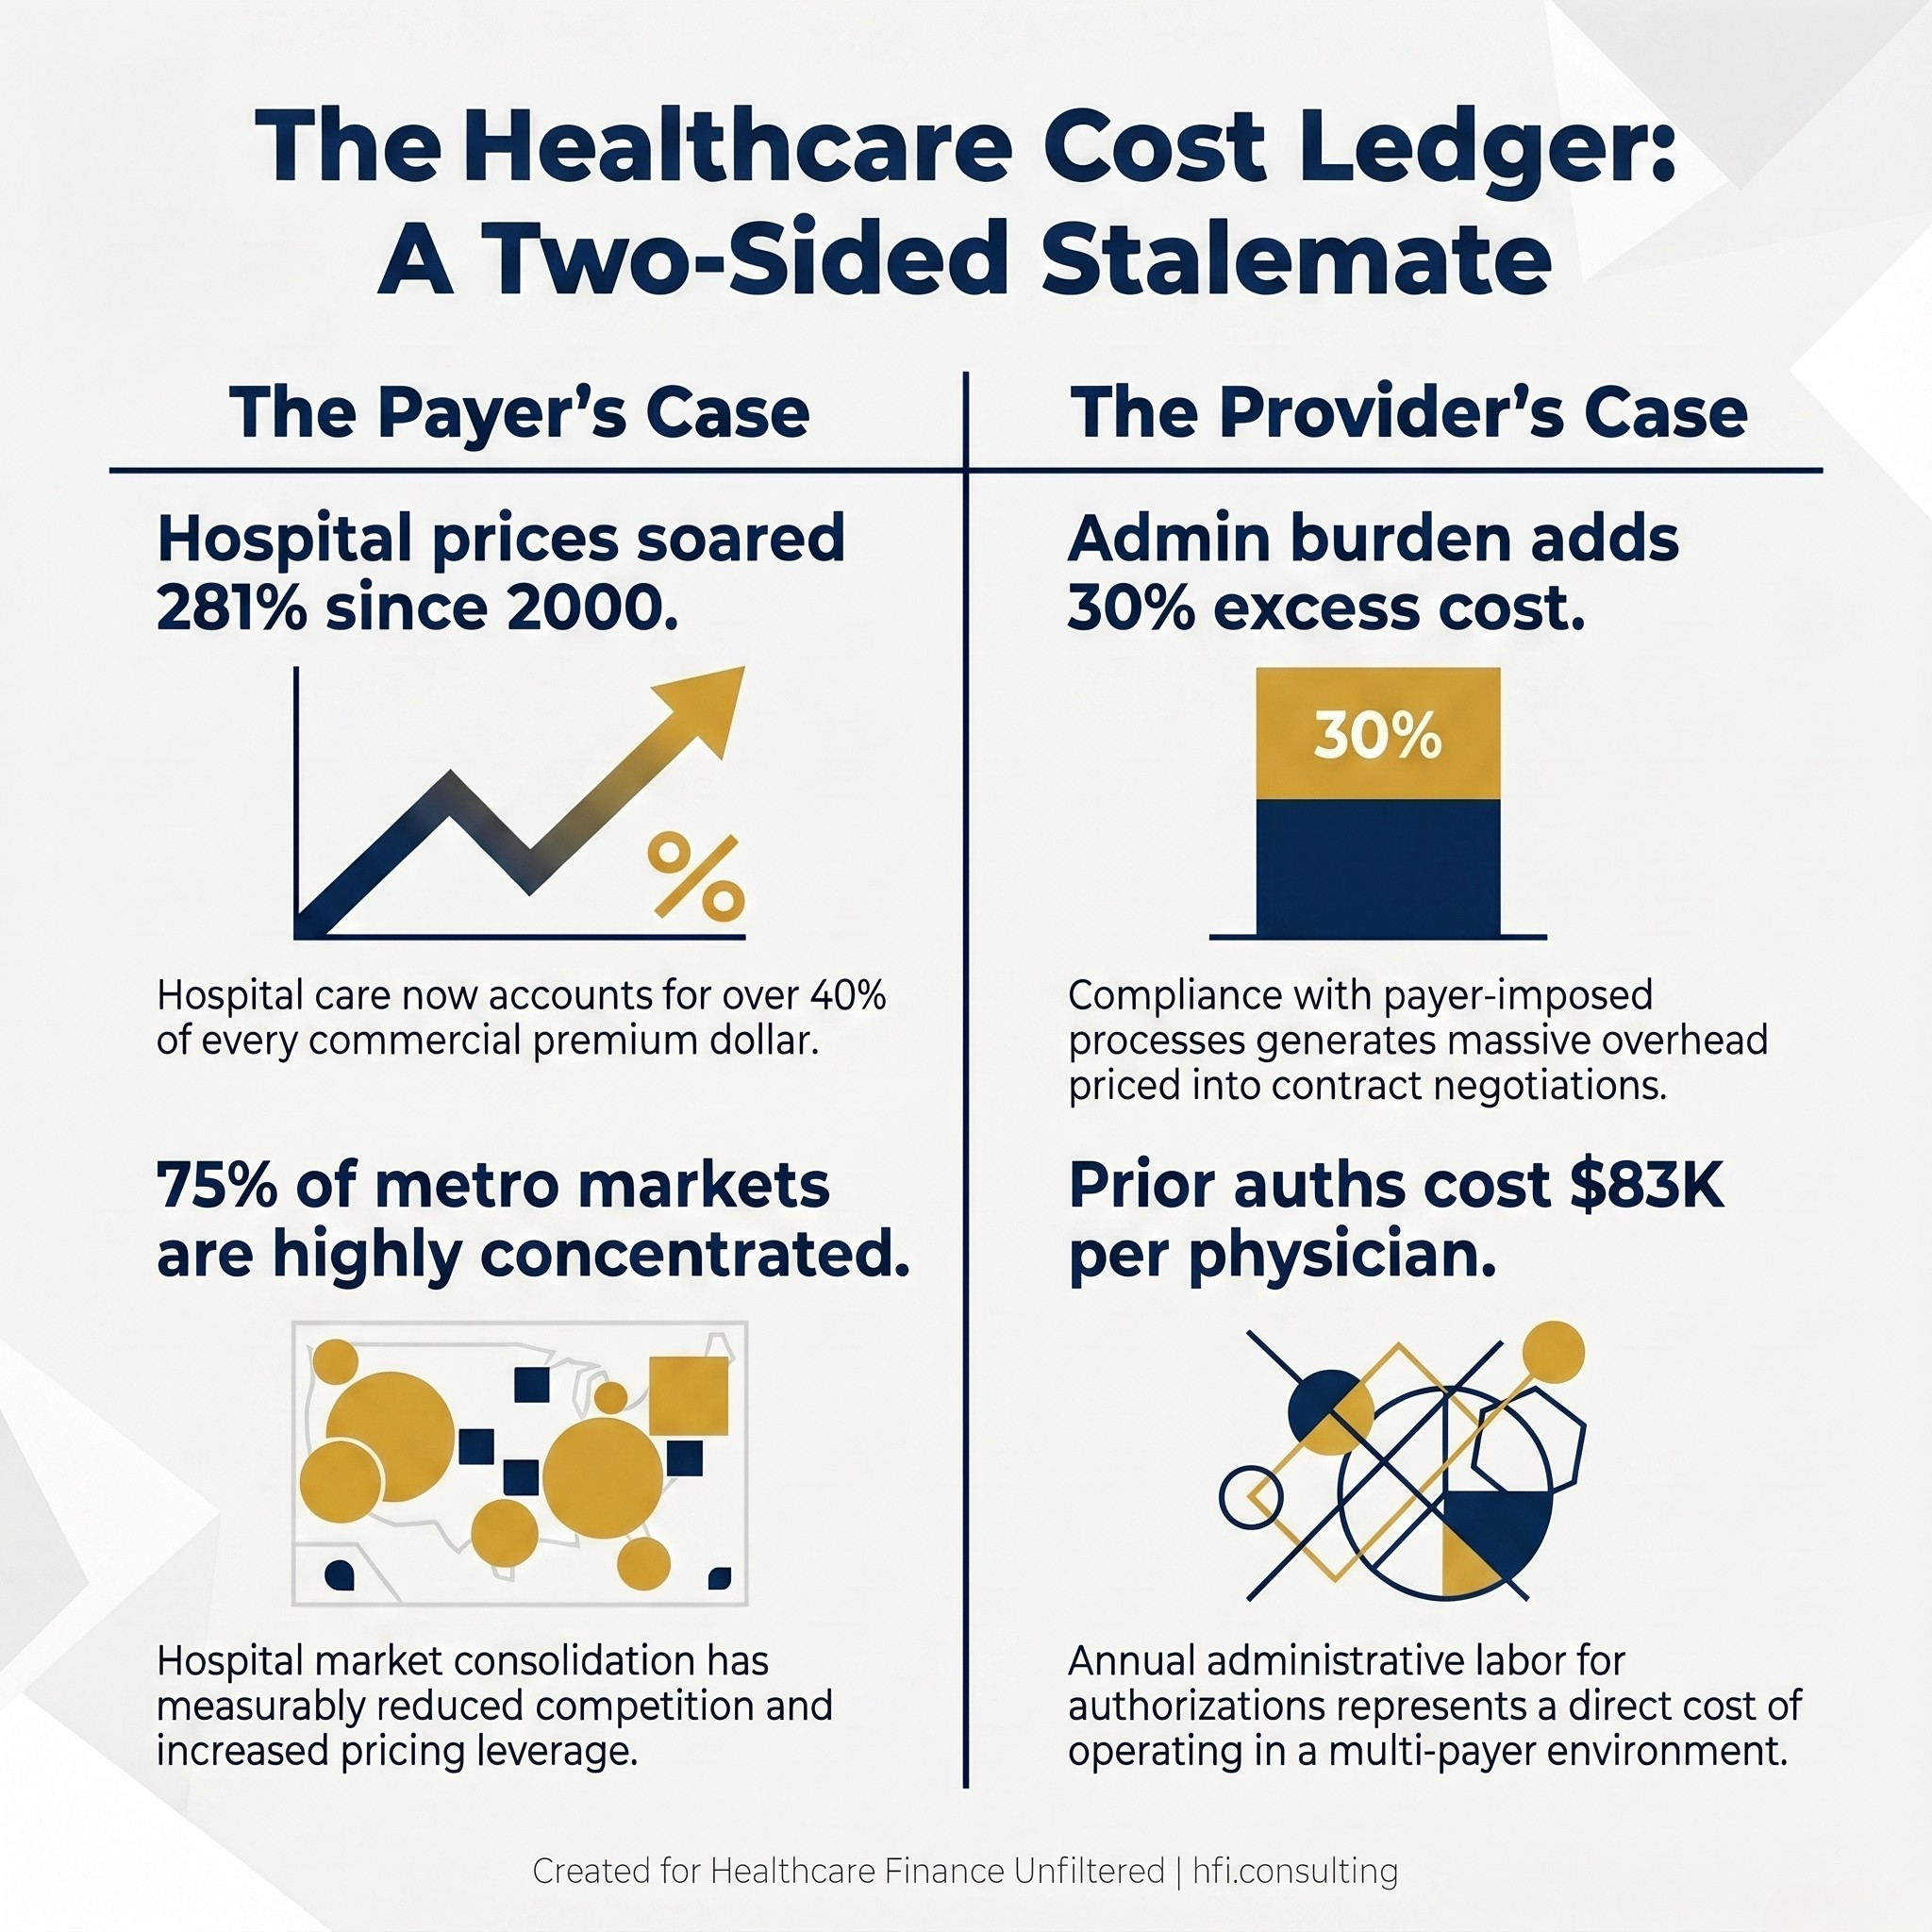
Side-by-side data card showing key financial statistics from both the payer and provider sides of the healthcare cost debate
The Payer Argument: "We Just Process What Providers Charge"
The health insurance industry's position on affordability rests on three data pillars, and all three are grounded in verifiable figures.
Hospital-based care, including inpatient, outpatient, and emergency room costs, accounts for more than 40 cents of every premium dollar in the commercial market. Payers use this to argue that they are effectively pass-through entities. When premiums rise, the cost of the underlying services drove that increase, not insurer margins.
Hospital market consolidation has measurably reduced competition. Three-quarters of U.S. metro areas are now classified as highly or very highly concentrated, and the economic relationship between reduced competition and higher prices is well-documented in healthcare research. When a health system acquires competitors across a region, its leverage in contract negotiations increases accordingly.
The revenue cycle optimization industry creates a structural pricing escalator. Hospitals and physician groups hire consultants and software vendors specifically to maximize billing capture, including through upcoding, which is billing for a more complex service than was provided. The extreme examples circulating in the congressional record this week, a $13,000 ambulance ride for six miles, $213,000 for rattlesnake antivenom, $445 for a nasal swab, are not representative of typical hospital billing. They are, however, illustrations of a pricing environment that operates without market-rate discipline at the point of service.
The payer narrative succeeds politically because it is anchored in observable disparity. The same routine procedure costs up to 13 times more in a hospital outpatient department than in an independent physician's office. When transparency advocates publish that comparison, hospitals are the ones with the higher-priced ledger.
What the "40 Cents" Argument Leaves Out
The payer argument is not wrong. It is selectively framed.
Provider systems carry significant administrative overhead that originates directly from payer process requirements. Prior authorization workflows, multi-payer claims submission systems, denial management operations, and appeals infrastructure add an estimated 15% to 30% in excess administrative cost to U.S. healthcare spending. That overhead is not a provider operational inefficiency. It is a compliance cost generated by payer system design, and it gets priced into contract negotiations.
The Medical Loss Ratio requirement under the ACA requires insurers to spend 80% to 85% of premiums on medical care. The stated intent is to cap administrative overhead and profit. The structural effect is more complicated: because the MLR caps the ratio rather than the dollar amount, rising total medical expenditure generates a larger absolute margin for the insurer within the same percentage band. A payer earning 15% on $100 in medical costs collects $17.65 in administrative and profit dollars. At $200 in medical costs, the same ratio generates $35.29. The MLR creates no financial incentive to reduce the denominator.
High-Deductible Health Plans have shifted a significant share of cost exposure directly onto patients. When a patient receives a $3,000 bill after a procedure, they interact with the hospital billing department. The insurer's plan design, which engineered that deductible structure, is invisible in that interaction. Providers bear both the collection burden and the reputational cost of a cost structure that was partially designed upstream by the payer.
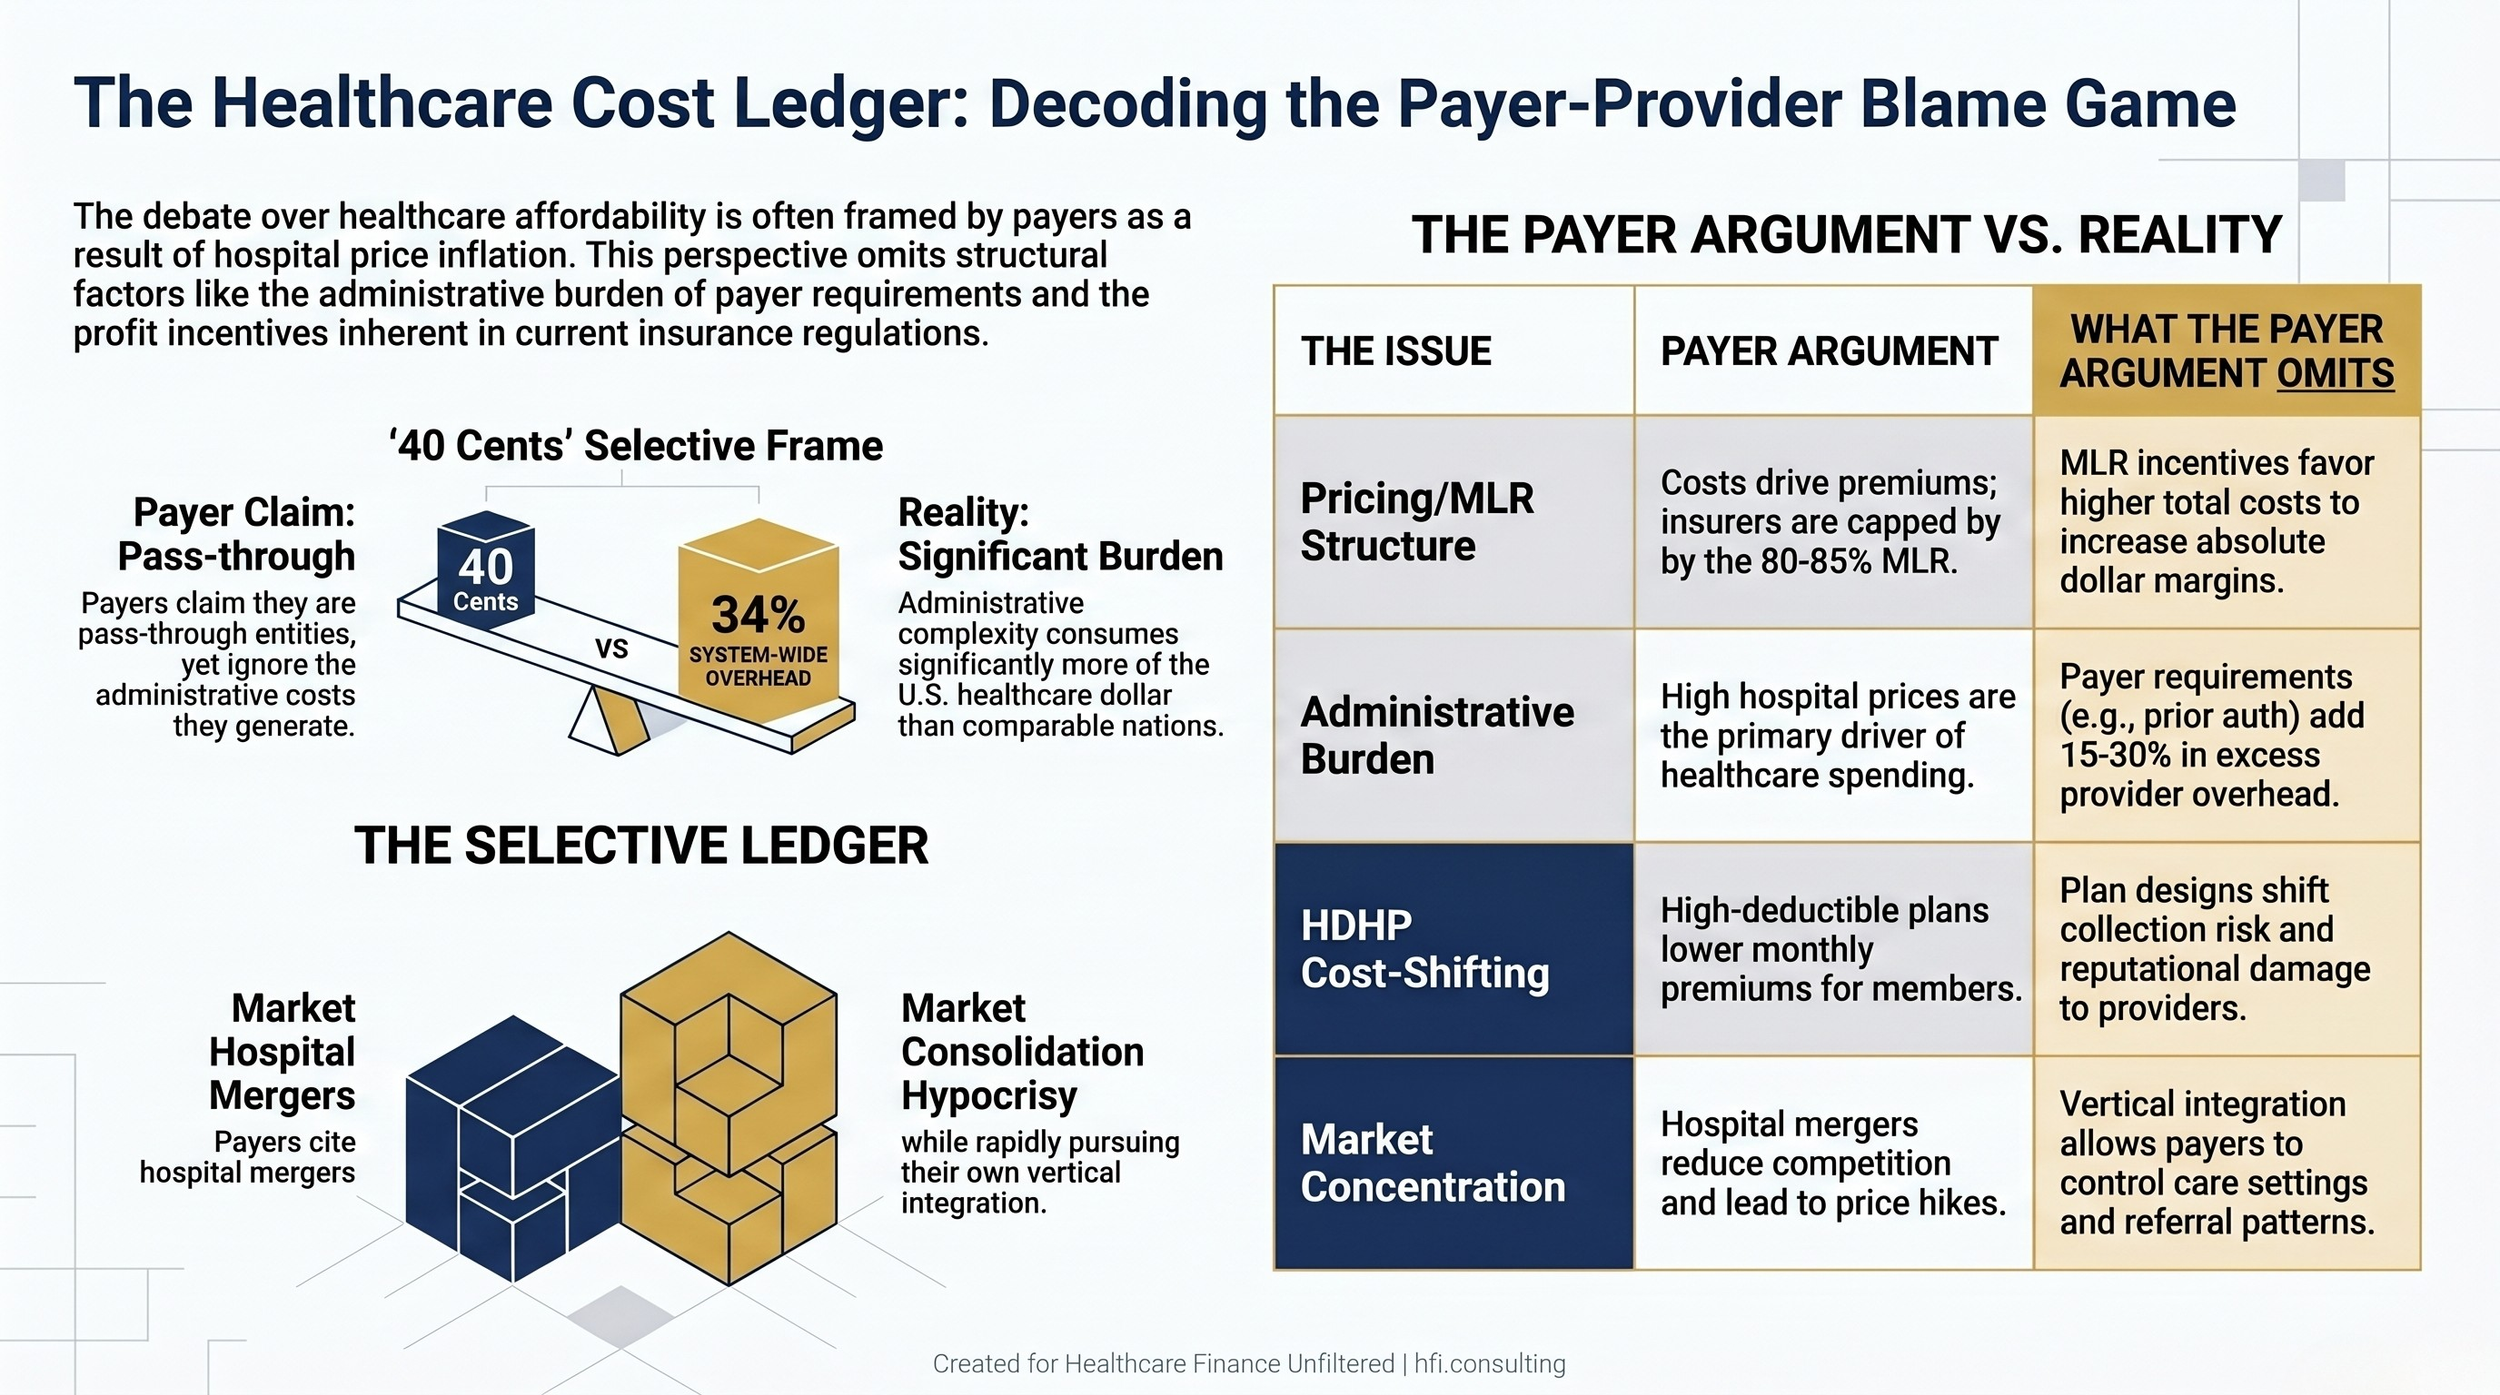
Comparison table showing payer arguments about healthcare costs alongside the structural factors each argument omits
The Provider Counter-Argument: "We Charge More Because We Have To"
Hospital and physician group finance leaders have built their own well-documented case, and it also rests on real data.
Administrative burden from payer-imposed processes is not anecdotal. Research consistently estimates that physician practices spend roughly $83,000 per physician annually on prior authorization administration alone. For a health system finance team managing dozens of active payer contracts, each with different coding requirements, authorization criteria, and appeals processes, that overhead scales accordingly. The staff required to manage that complexity are a direct cost of operating in a multi-payer environment.
Payer-side consolidation mirrors the consolidation payers cite on the provider side, and it is increasingly vertical. Large managed care organizations now own pharmacy benefit managers, primary care practices, home health companies, and in some cases ambulatory surgery centers. That vertical integration gives payers significant control over care settings, referral patterns, and pricing within their own networks, which complicates the "claims processor" framing considerably.
In my work across multi-hospital systems and at a Level I Trauma Center, the practical cost-shifting calculus was straightforward: Medicare and Medicaid reimbursements consistently fell short of fully-loaded cost, and commercial contracts had to absorb the shortfall. That is not a billing strategy designed to generate excess margin. It is a financial architecture that exists because government programs do not pay cost, and someone has to. At UF Health Jacksonville, a safety-net facility with a significant Medicaid and uninsured population, that math shaped every contract negotiation.
The most recent congressional testimony also cited a JAMA study linking private equity ownership and hospital consolidation to rising primary care costs, not as separate market phenomena but as interrelated ones. When private equity enters physician group ownership with investor return as the primary mandate, practice operations and billing behavior change in measurable ways.
The Structural Stalemate: Why This Argument Never Resolves
Neither side's argument resolves the other because both are correct about external behavior and selectively silent about internal incentives.
Payers are correct that hospital prices are high and variable. Providers are correct that the administrative burden is real and compounding. Both sides benefit, at least in the short term, from a system where costs flow through multiple intermediaries without full transparency at any single point. The complexity itself is profitable for the organizations that have built operational infrastructure around navigating it.
The congressional debate reflects this dynamic. Bipartisan agreement that costs are too high does not generate bipartisan agreement on which behavior changes first. Site-neutral payment reform, which would eliminate the pricing differential between hospital outpatient departments and independent physician offices, has been proposed and stalled repeatedly. Anti-consolidation enforcement involves multiple agencies with overlapping jurisdictions. The No Surprises Act arbitration process has generated litigation, regulatory back-and-forth, and, according to AHIP, more than $5 billion in wasteful spending in its first two years as private equity-backed providers flooded the system with disputed claims.
For CFOs on either side, the stalemate is not an abstraction. It is the operating environment in which contract negotiations, capital decisions, and staffing models are made. The strategic question is not which side is correct. It is what the current environment requires your finance function to do.
If your team is working through payer contract strategy, service line pricing analysis, or the financial modeling behind site-neutral payment scenarios, that is the kind of operational work I do with finance teams. Connect with me at hfi.consulting.
What Provider-Side CFOs Need to Model Now
Congressional attention to hospital pricing creates near-term policy risk in three specific areas, and all three require active financial modeling in 2026.
Site-neutral payment reform has the broadest bipartisan support and the clearest financial model. If Medicare payment rates for procedures performed in hospital outpatient departments align with independent physician office rates, outpatient revenue per procedure declines significantly for hospital-affiliated facilities. Finance teams should be running those scenarios now, even absent passed legislation, because the directional trajectory is sustained and bipartisan.
Anti-consolidation enforcement creates deal risk for pending or planned acquisitions. FTC posture toward hospital mergers has been more aggressive in recent years, and this week's congressional testimony reinforces that political environment. Any acquisition in your capital pipeline needs regulatory timeline risk built into the financial model.
Pricing transparency requirements are likely to become more rigorous. The hospital price transparency rule has driven uneven compliance, and enforcement has been inconsistent. A stricter enforcement environment means that pricing variation across service lines will be visible to payers, employers, and regulators in ways it has not been previously. An internal pricing audit, conducted before that visibility is mandated, gives your team time to rationalize variation and build the narrative around legitimate cost drivers.
For a deeper analysis of revenue cycle technology as a cost reduction lever independent of the policy outcome, see AI-Powered Revenue Leakage Prevention: The CFO's Implementation Guide for 2026.
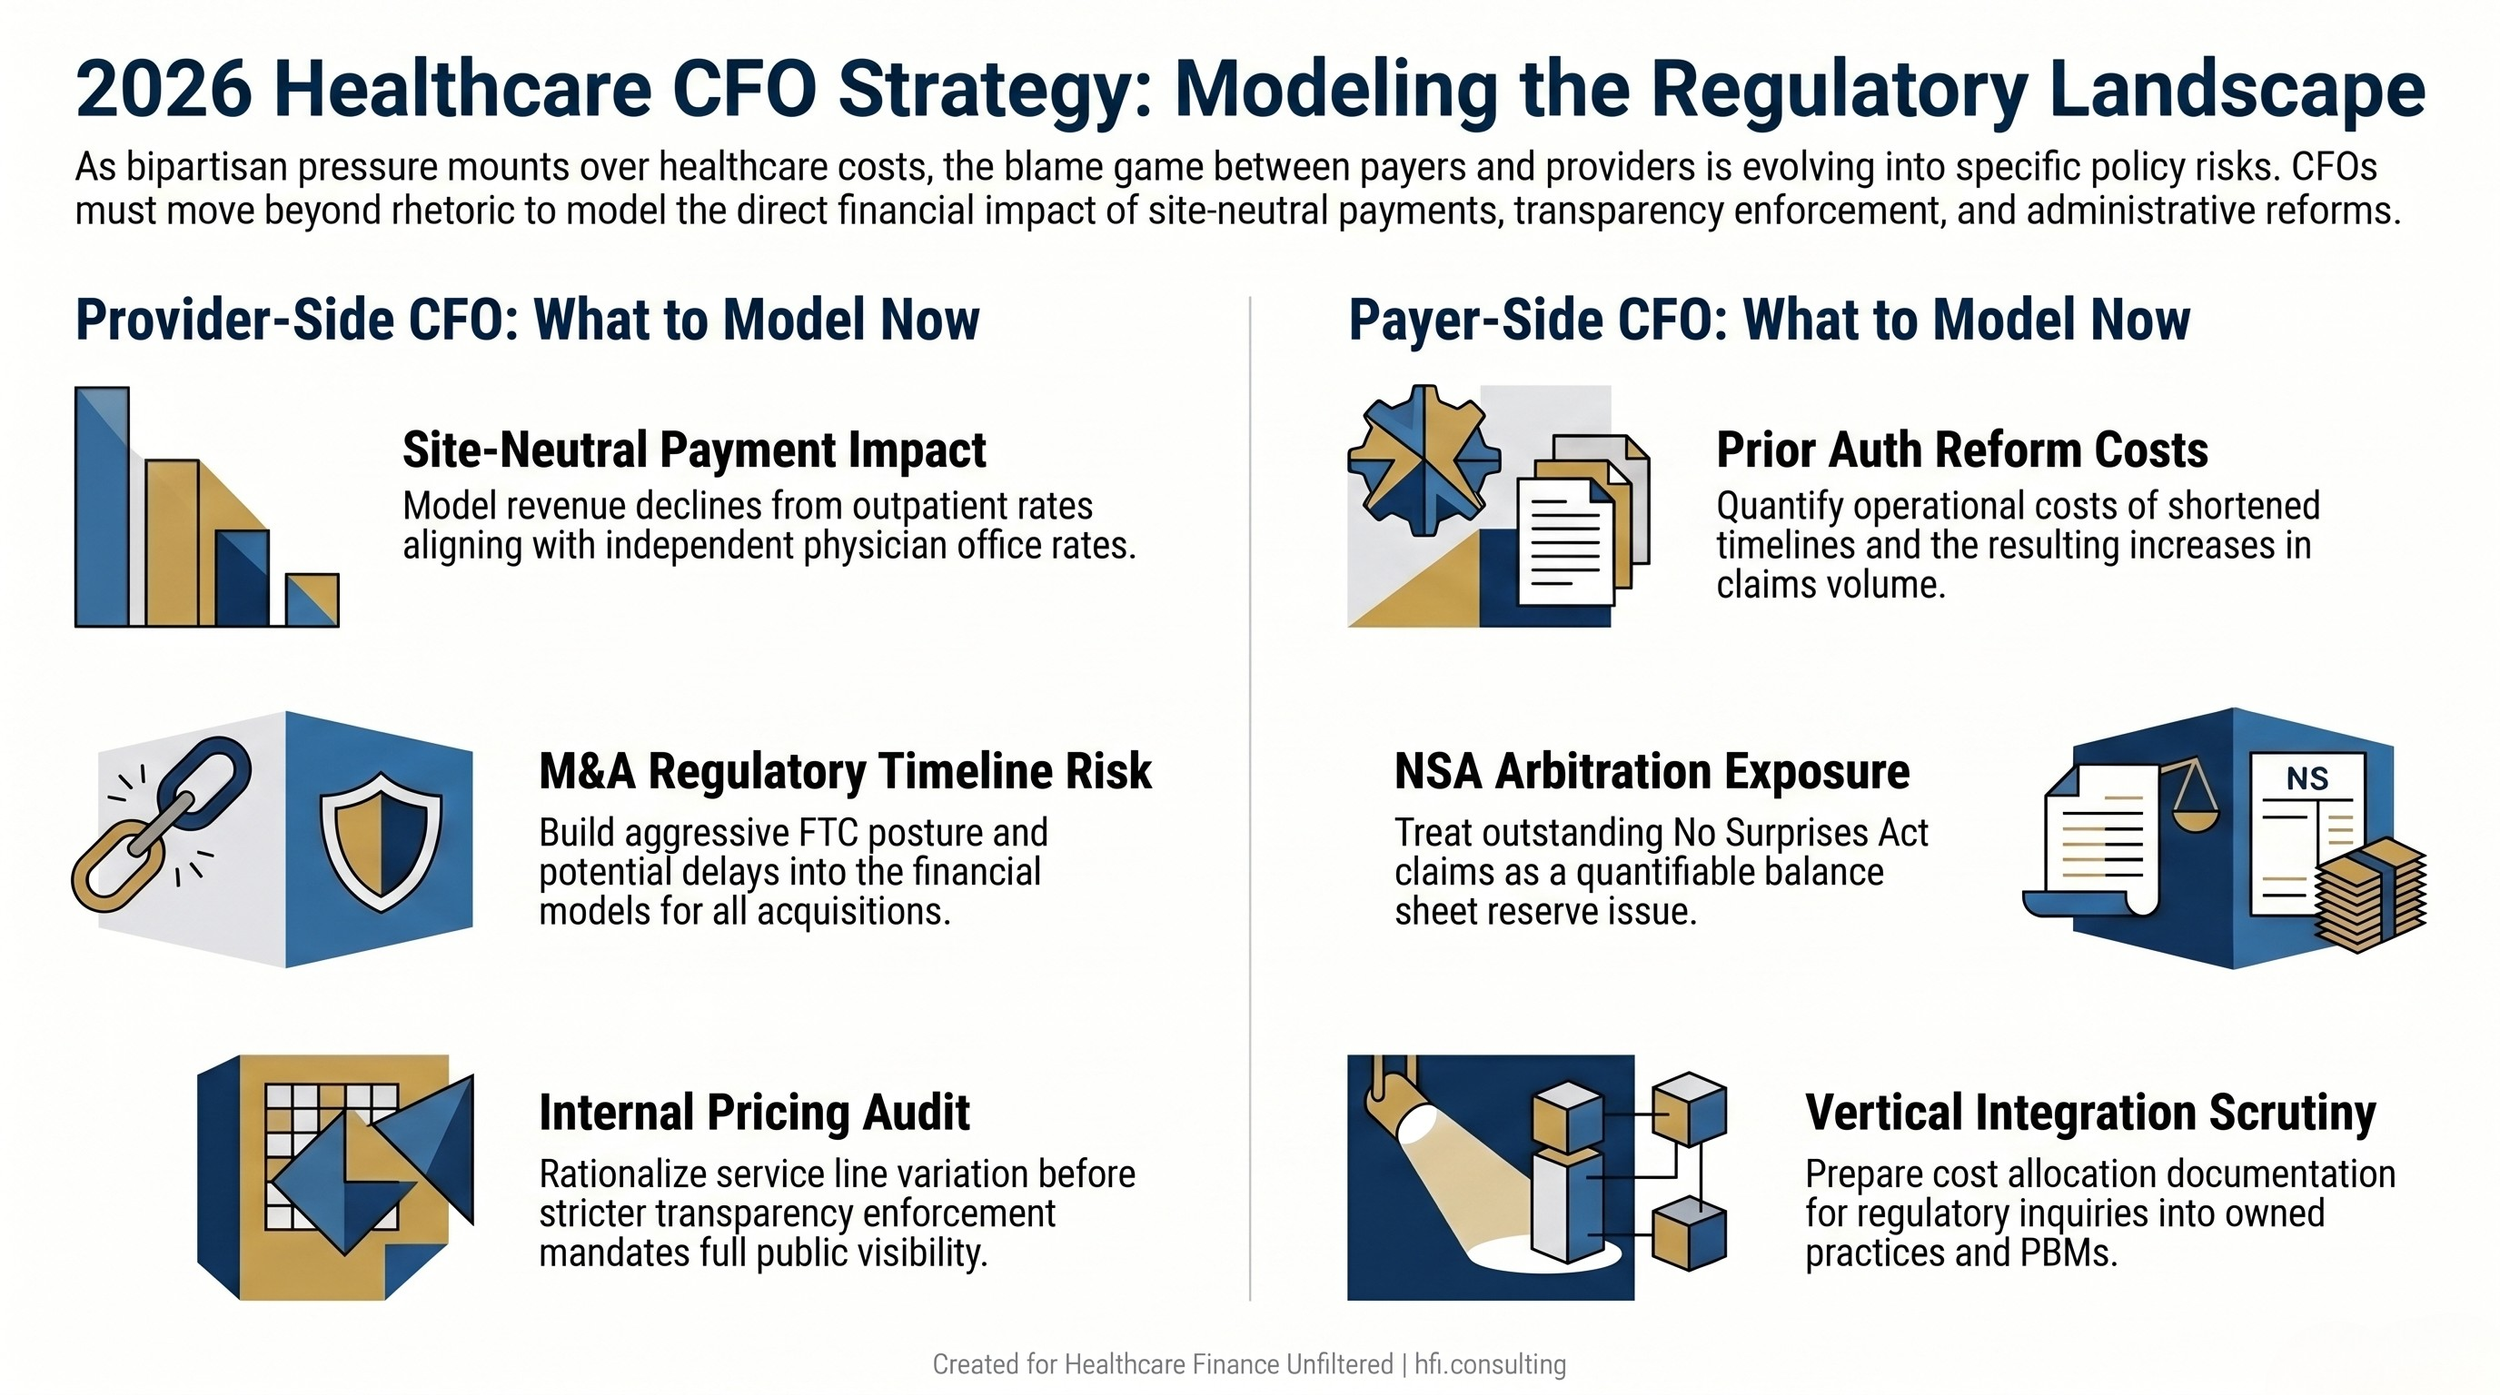
Parallel decision flowcharts showing key modeling priorities for provider-side and payer-side CFOs in the current policy environment
What Payer-Side CFOs Need to Model Now
The same political environment creating risk for providers creates distinct exposures for health plan finance teams.
Prior authorization reform is accumulating legislative momentum at both the state and federal levels. Multiple states have already enacted authorization timeline requirements, and federal proposals exist across multiple congressional sessions. Finance teams should model the operational cost of shortened authorization timelines and the potential claims volume increase if authorization denial rates are constrained by new regulatory requirements. The MLR calculation also becomes more complicated if prior authorization functions are reclassified, even partially, from clinical management to administrative overhead.
No Surprises Act arbitration exposure requires ongoing balance sheet monitoring. If regulatory enforcement tightens around claim eligibility criteria, outstanding arbitration claims and pipeline volume represent a quantifiable financial exposure. This is a reserve and accrual question, not only a compliance question, and it belongs in your current-quarter financial review.
Vertical integration scrutiny is escalating. Payer-owned physician practices, pharmacy benefit managers, and home health operations were explicitly named in this week's congressional testimony. Finance leaders at large managed care organizations should anticipate that integration structures will attract additional regulatory attention and should have operational separation analyses and cost allocation documentation ready for a regulatory inquiry.
For payer-side context on how contract network structure affects total plan exposure, see Medicare Advantage Network Contraction 2026 and 340B Program Update: Rebate Model Dead, But Manufacturer Data Demands Escalate.
The Number Neither Side Puts on the Slide
The figure that rarely appears in either side's congressional testimony is the total administrative cost of the U.S. system relative to comparable health systems elsewhere. A 2020 analysis published in the Annals of Internal Medicine by researchers from Harvard Medical School and CUNY found that administrative costs accounted for 34.2% of total U.S. health expenditures, representing approximately $812 billion at the time and roughly $2,500 per person. Canada's comparable figure in the same study was approximately 17%. OECD data for peer nations with simpler payer structures generally falls well under 25%.
That overhead is distributed across both sides of this debate. The multi-payer system creates a bureaucracy arms race: providers staff coding and billing operations to navigate thousands of different plan requirements, and payers staff medical review and claims teams to manage utilization under those same rules. A 2021 McKinsey analysis estimated that $265 billion in annual U.S. healthcare spending represents wasteful administration that could be simplified without affecting care quality. Neither side's congressional brief leads with that figure.
This matters for CFO strategy because it means the cost reduction opportunity inside each organization is real and accessible, regardless of how the political argument resolves. Revenue cycle automation, prior authorization process redesign, contract management infrastructure, and data analytics investments all target administrative cost that exists independently of who wins the blame game.
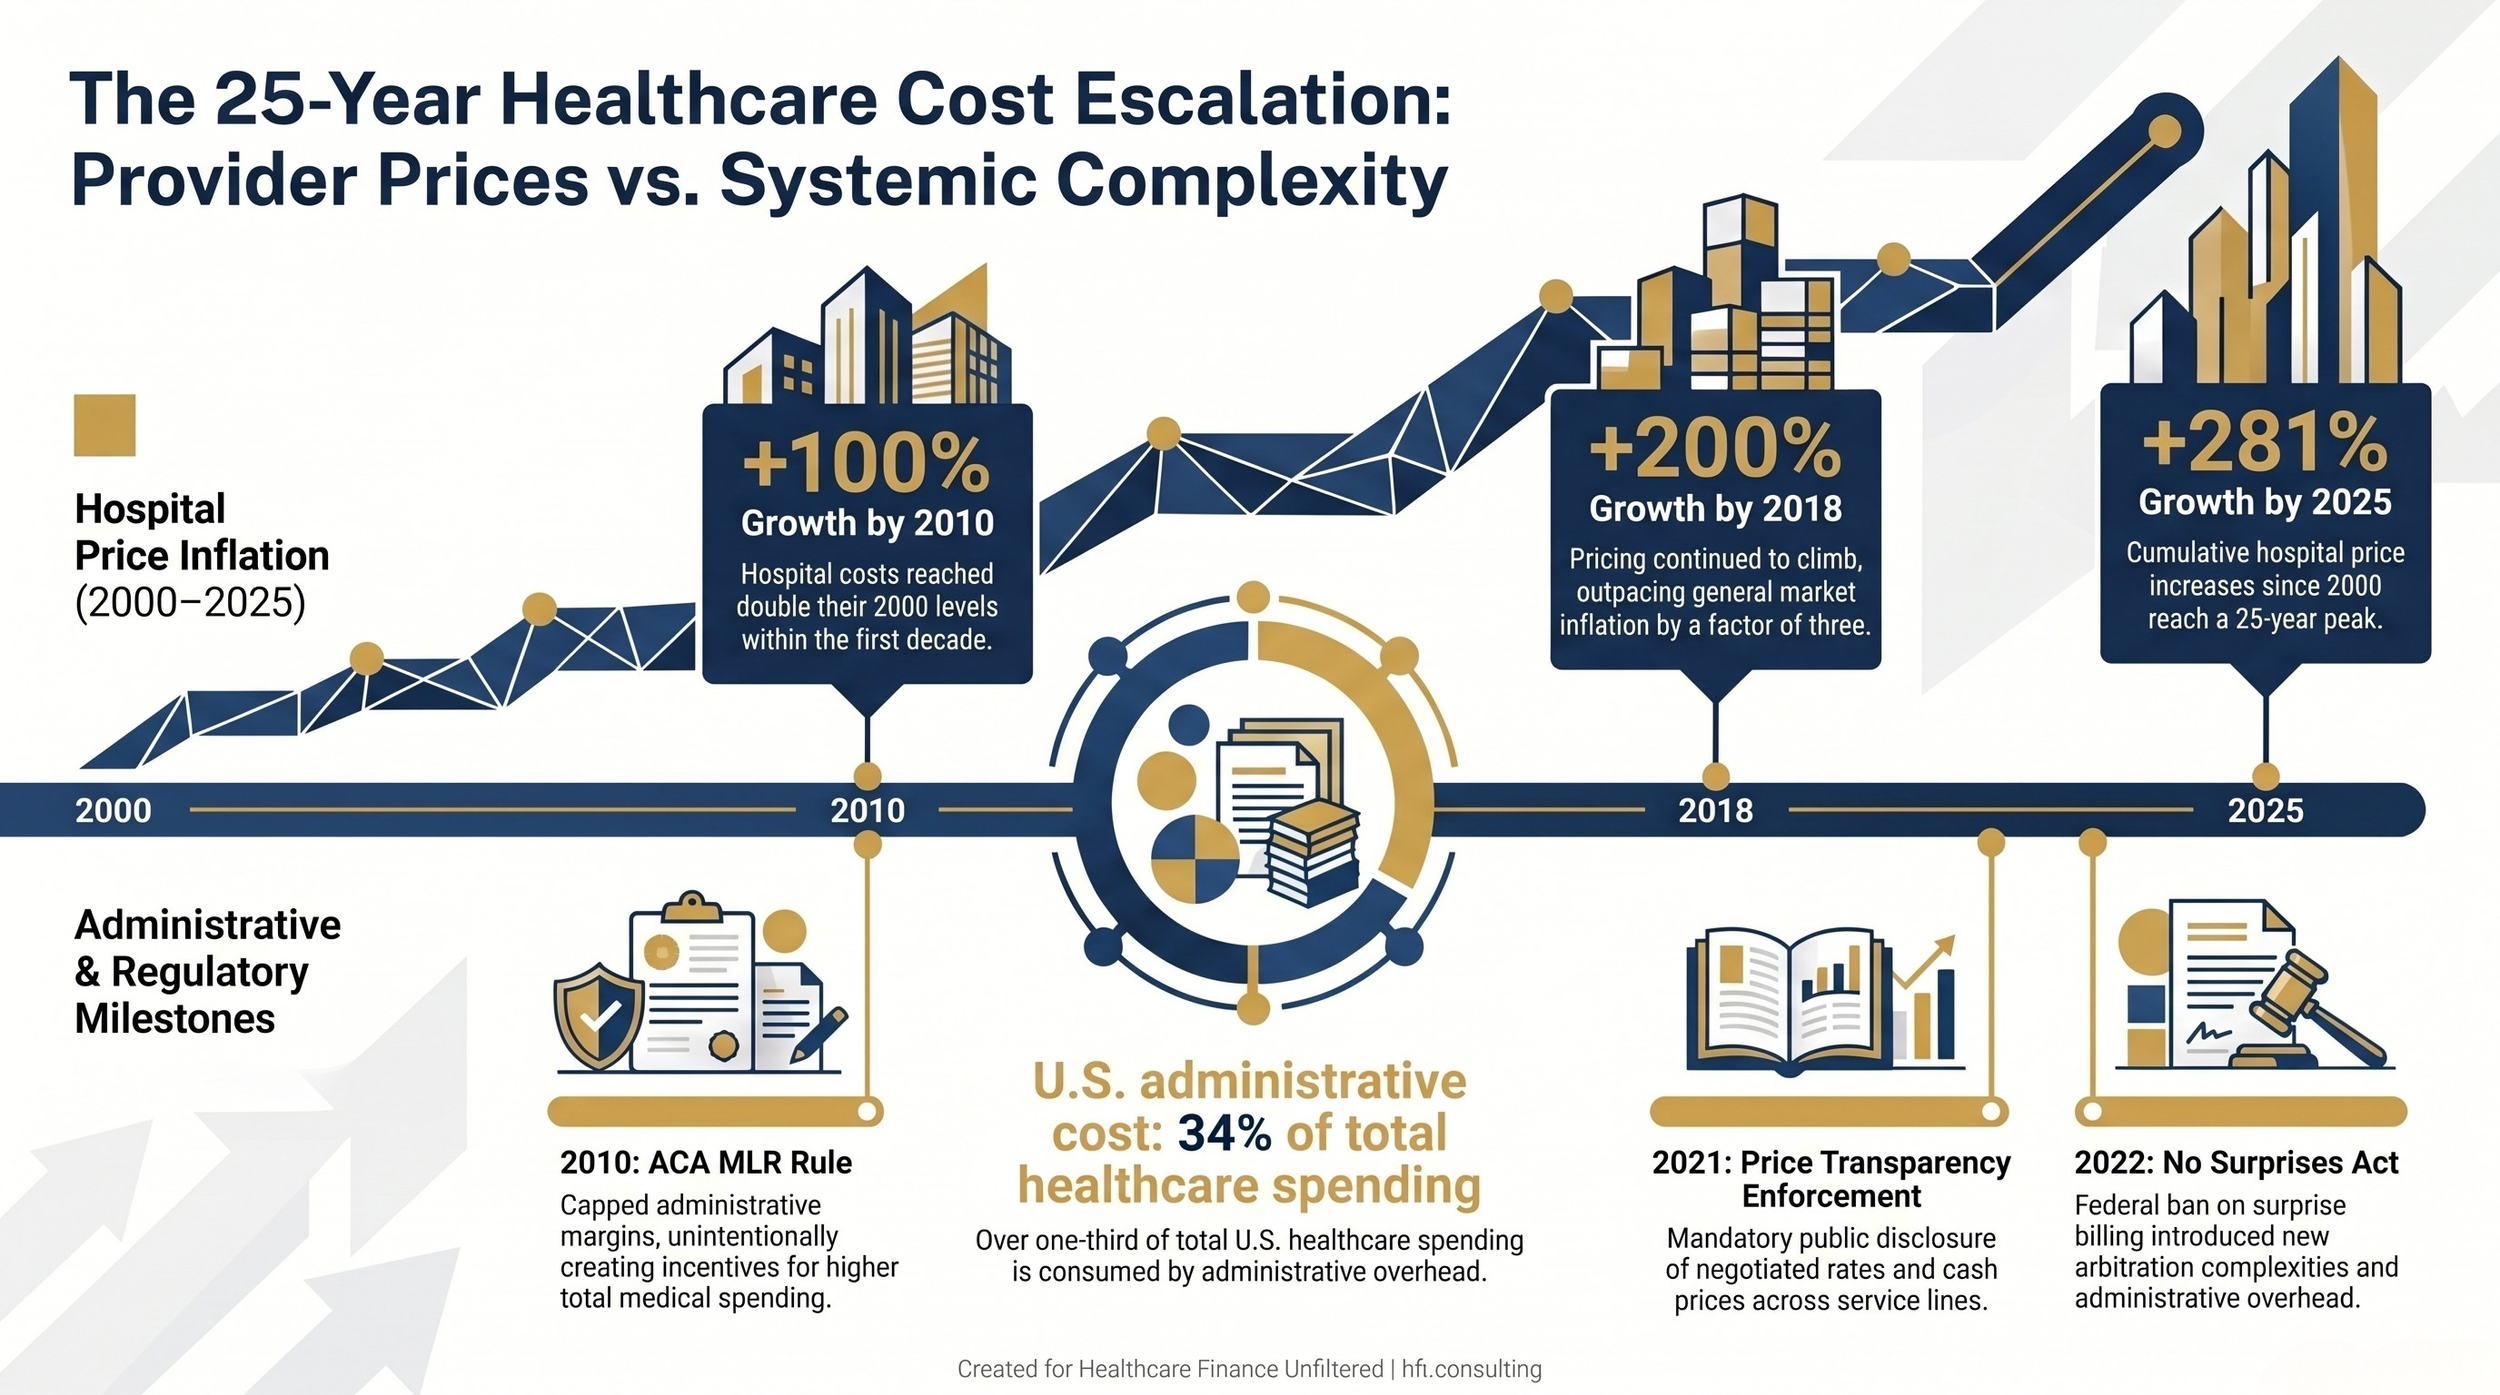
Dual-track timeline showing hospital price inflation from 2000 to 2025 alongside key regulatory events and U.S. administrative cost data
The CFO's Frame for an Unresolved Argument
The payer vs. provider blame game will continue in Washington. Both industries benefit from having a visible external antagonist, and the congressional attention that this conflict generates sustains both industries' regulatory positioning.
Your finance function cannot wait for the argument to resolve. The modeling work required for site-neutral payment scenarios, prior authorization reform impacts, and pricing transparency compliance is 2026 budget work. It belongs on your planning calendar now, not after legislation passes.
The organizations best positioned when policy does shift are the ones that have already run the numbers on the scenarios most likely to move. The blame game is not your problem to solve. The financial exposure underneath it is.
Healthcare Finance Unfiltered publishes operational analysis for finance leaders who need the context behind the policy headlines. If this framework is useful to your planning process, share it with a colleague on the other side of the payer/provider ledger. The full picture requires both perspectives.
Connect with me at hfi.consulting for consulting work on contract strategy, service line margin analysis, or regulatory impact modeling.
P.S. Which scenario is your finance team actively modeling right now: site-neutral payment reform, prior authorization timeline changes, or pricing transparency audit preparation? Hit reply and let me know. I read every response.