
Healthcare Bankruptcy 2026: The CFO's Restructuring Playbook Before the 2027 Margin Cliff
Q1 filings jumped 33%. Four restructuring moves healthcare finance leaders must make now before the 2027 margin cliff arrives.
Healthcare bankruptcy filings rose 33% in Q1 2026 compared to Q4 2025. That is not a warning sign on the horizon. It is a current condition playing out across physician practices, senior living facilities, and regional hospital systems right now. Gibbins Advisors tracked 12 major filings in Q1 alone, with liabilities exceeding $10 million each, and the pace is accelerating.
The organizations entering distress are not failing for lack of volume. They are failing because of capital structures built for a different interest rate environment, labor models that never fully adjusted after 2022, and payer mix assumptions that required commercial cross-subsidization to hold indefinitely. It hasn't.
For CFOs who are not yet in distress, the question is not whether the pressure is real. It is whether the restructuring work happens proactively, on your terms, or reactively, with an advisor already in the room.
Here is the four-part framework that separates the organizations navigating this moment from the ones sliding toward it.
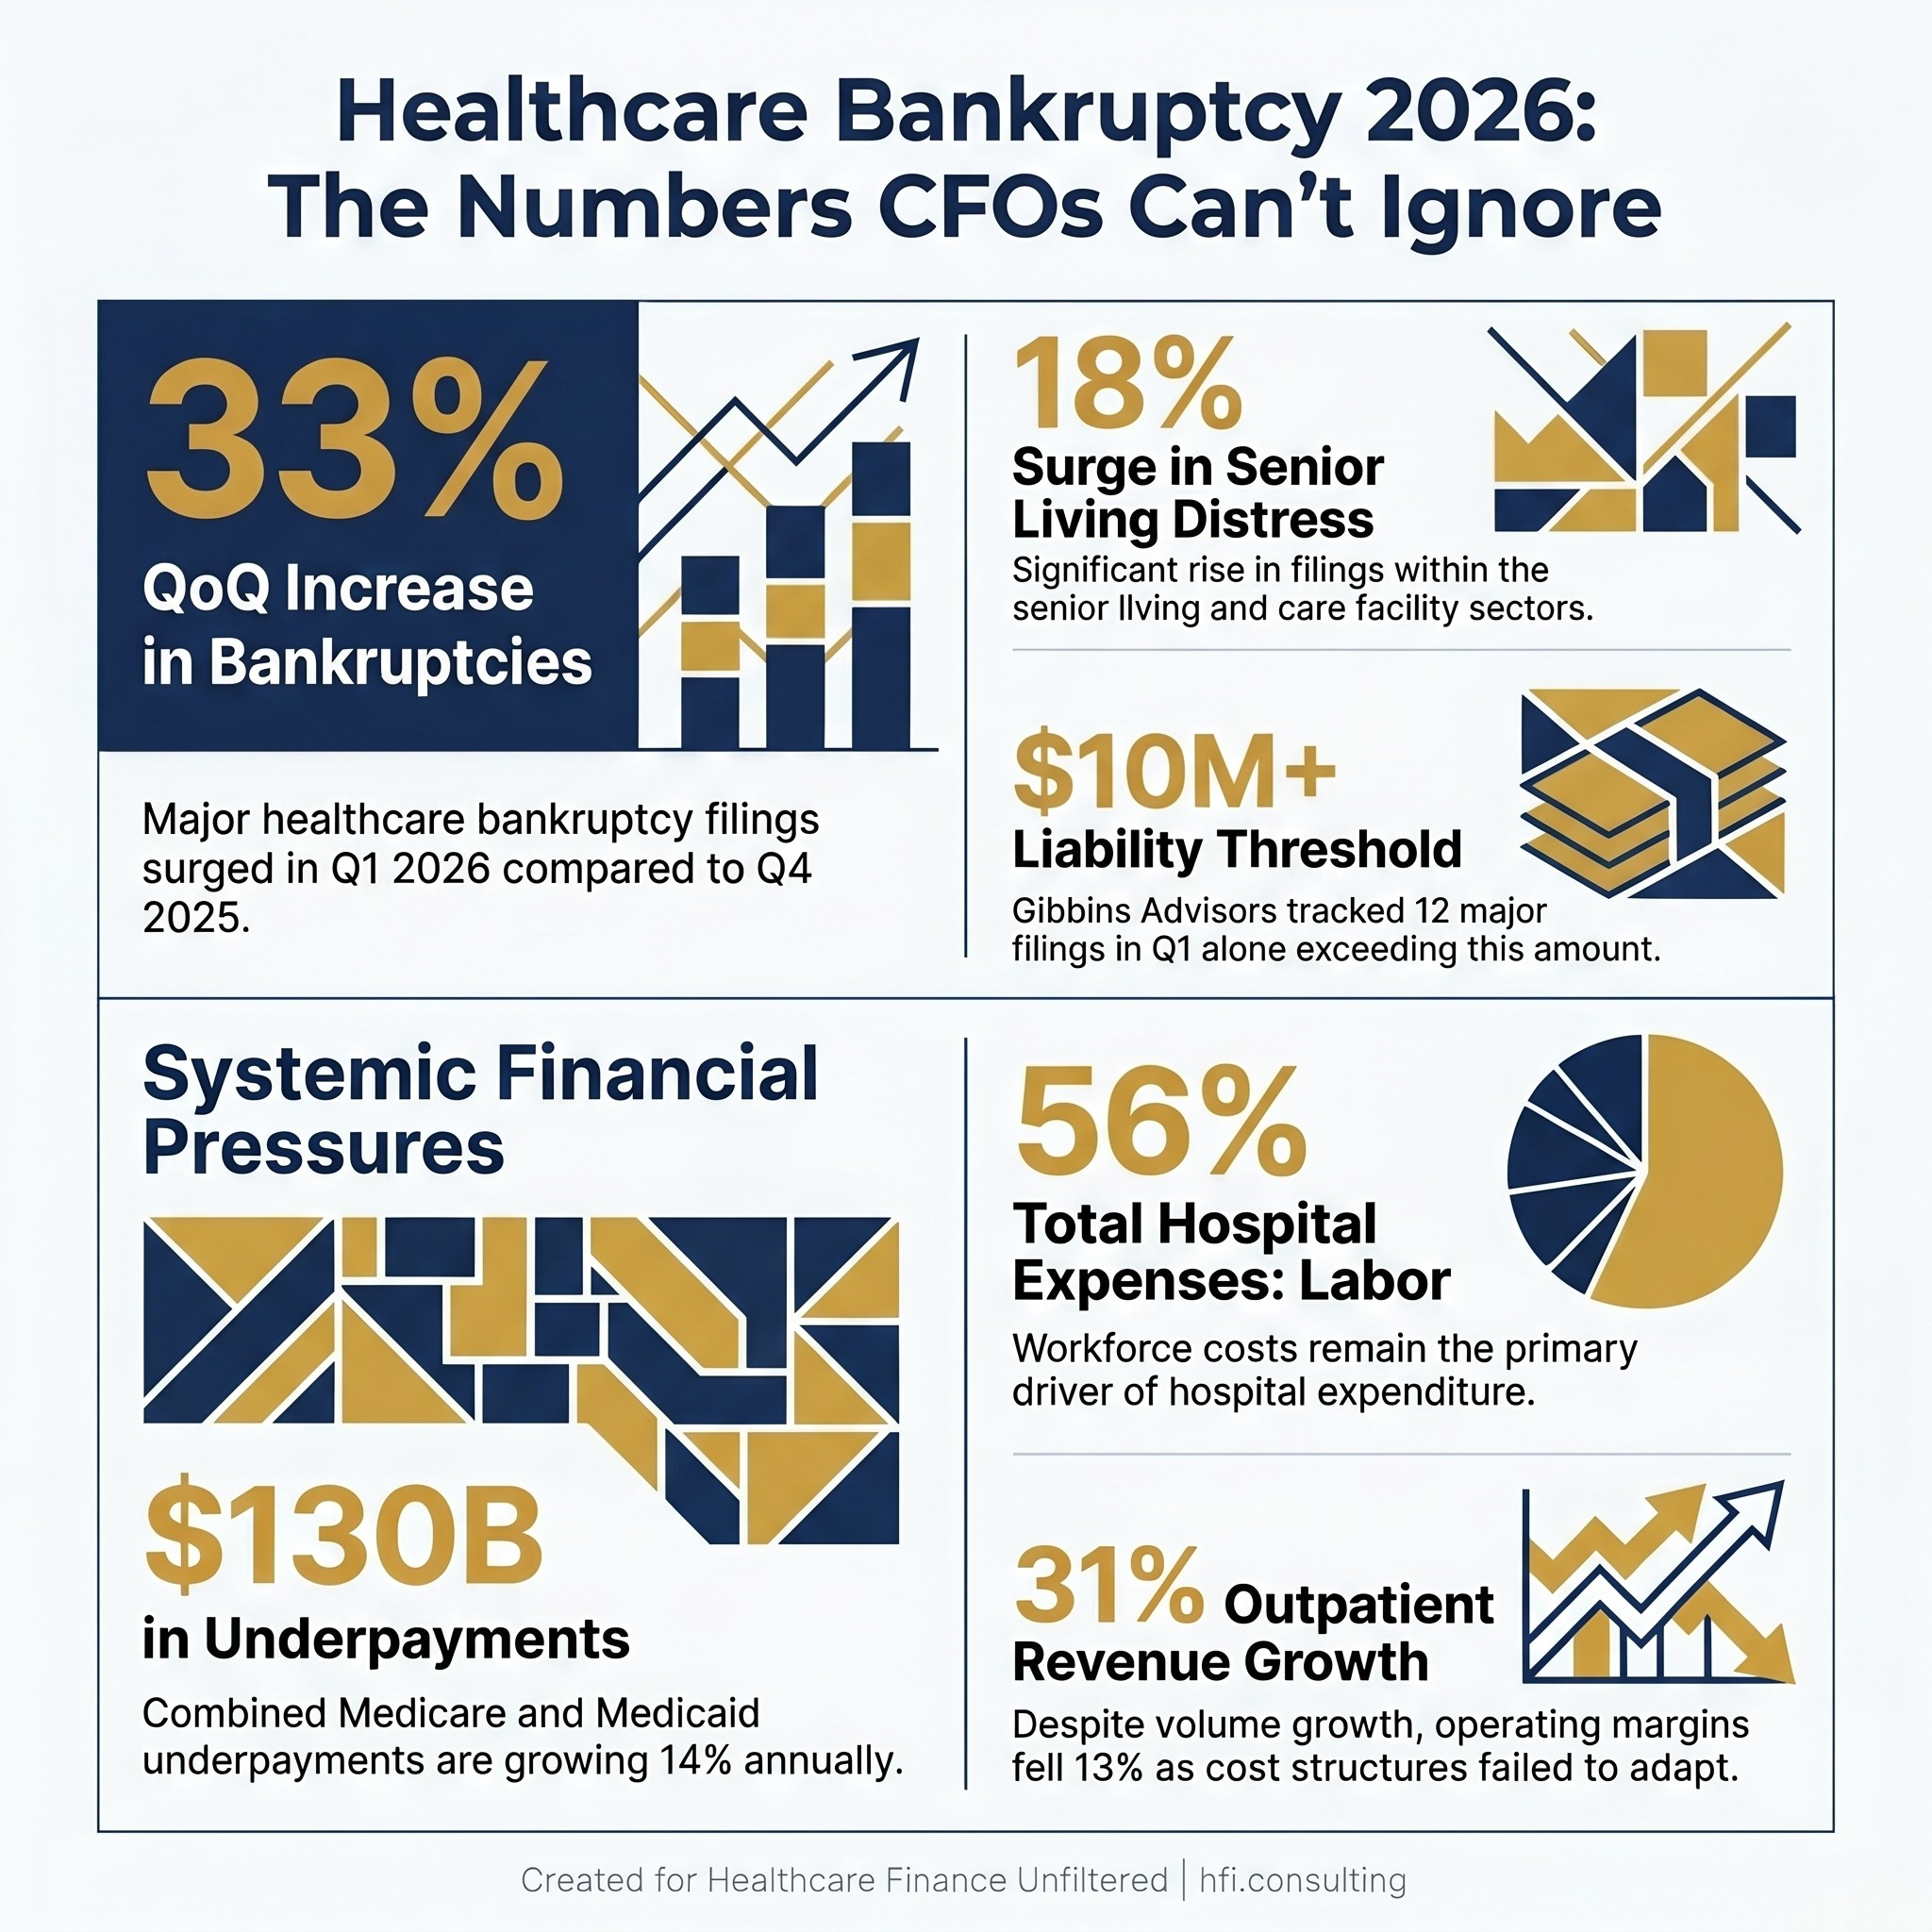
Infographic showing four key 2026 healthcare bankruptcy statistics including a 33% quarterly filing increase and $130 billion in Medicare and Medicaid underpayments
1. Radical Cost Accounting for the GLP-1 Era
Pharmacy expenses are no longer a background cost category. In 2026, they became the primary driver of a projected 9.5% increase in employer healthcare costs. GLP-1 medications alone are on track to represent 14% of total drug spend at major health systems. For hospital CFOs, the structural problem is specific: GLP-1s are largely administered in outpatient settings, but their price tag can eliminate a service line's contribution margin in a single quarter if not tracked at the case level.
Most systems still track pharmacy spend as a consolidated supply line. That approach worked when no single drug class could move margin by several percentage points. It does not work in the GLP-1 era.
The shift required is the same one that already happened with orthopedic implants. Variable, high-cost items need case-level tracking, physician-level visibility, and payer-specific reconciliation. GLP-1s belong in the same category. If your implant cost and contribution margin infrastructure is already built, pharmacy is the logical next application of that same framework.
In my work at Ascension across seven hospitals, the finance team's ability to catch margin erosion at the case level, before it became a service line problem, was the difference between a variance that got managed and one that got explained after the fact. The systems that did this well had cost accounting that moved at clinical speed, not at month-end close speed.
For CFOs building this infrastructure now, three moves matter most.
First, isolate variable high-cost drug triggers and track them by payer, by physician, and by procedure, the same way you track high-cost implants. Second, deploy AI-driven authorization and claim reconciliation starting with the highest-cost categories rather than waiting for a system-wide overhaul. Mercyhealth has already demonstrated that targeted AI deployment can close a 25% revenue leakage gap driven by denied specialty drug claims. Third, build the internal business case for pharmacy cost accounting as a finance infrastructure investment. The framing matters for capital approval.
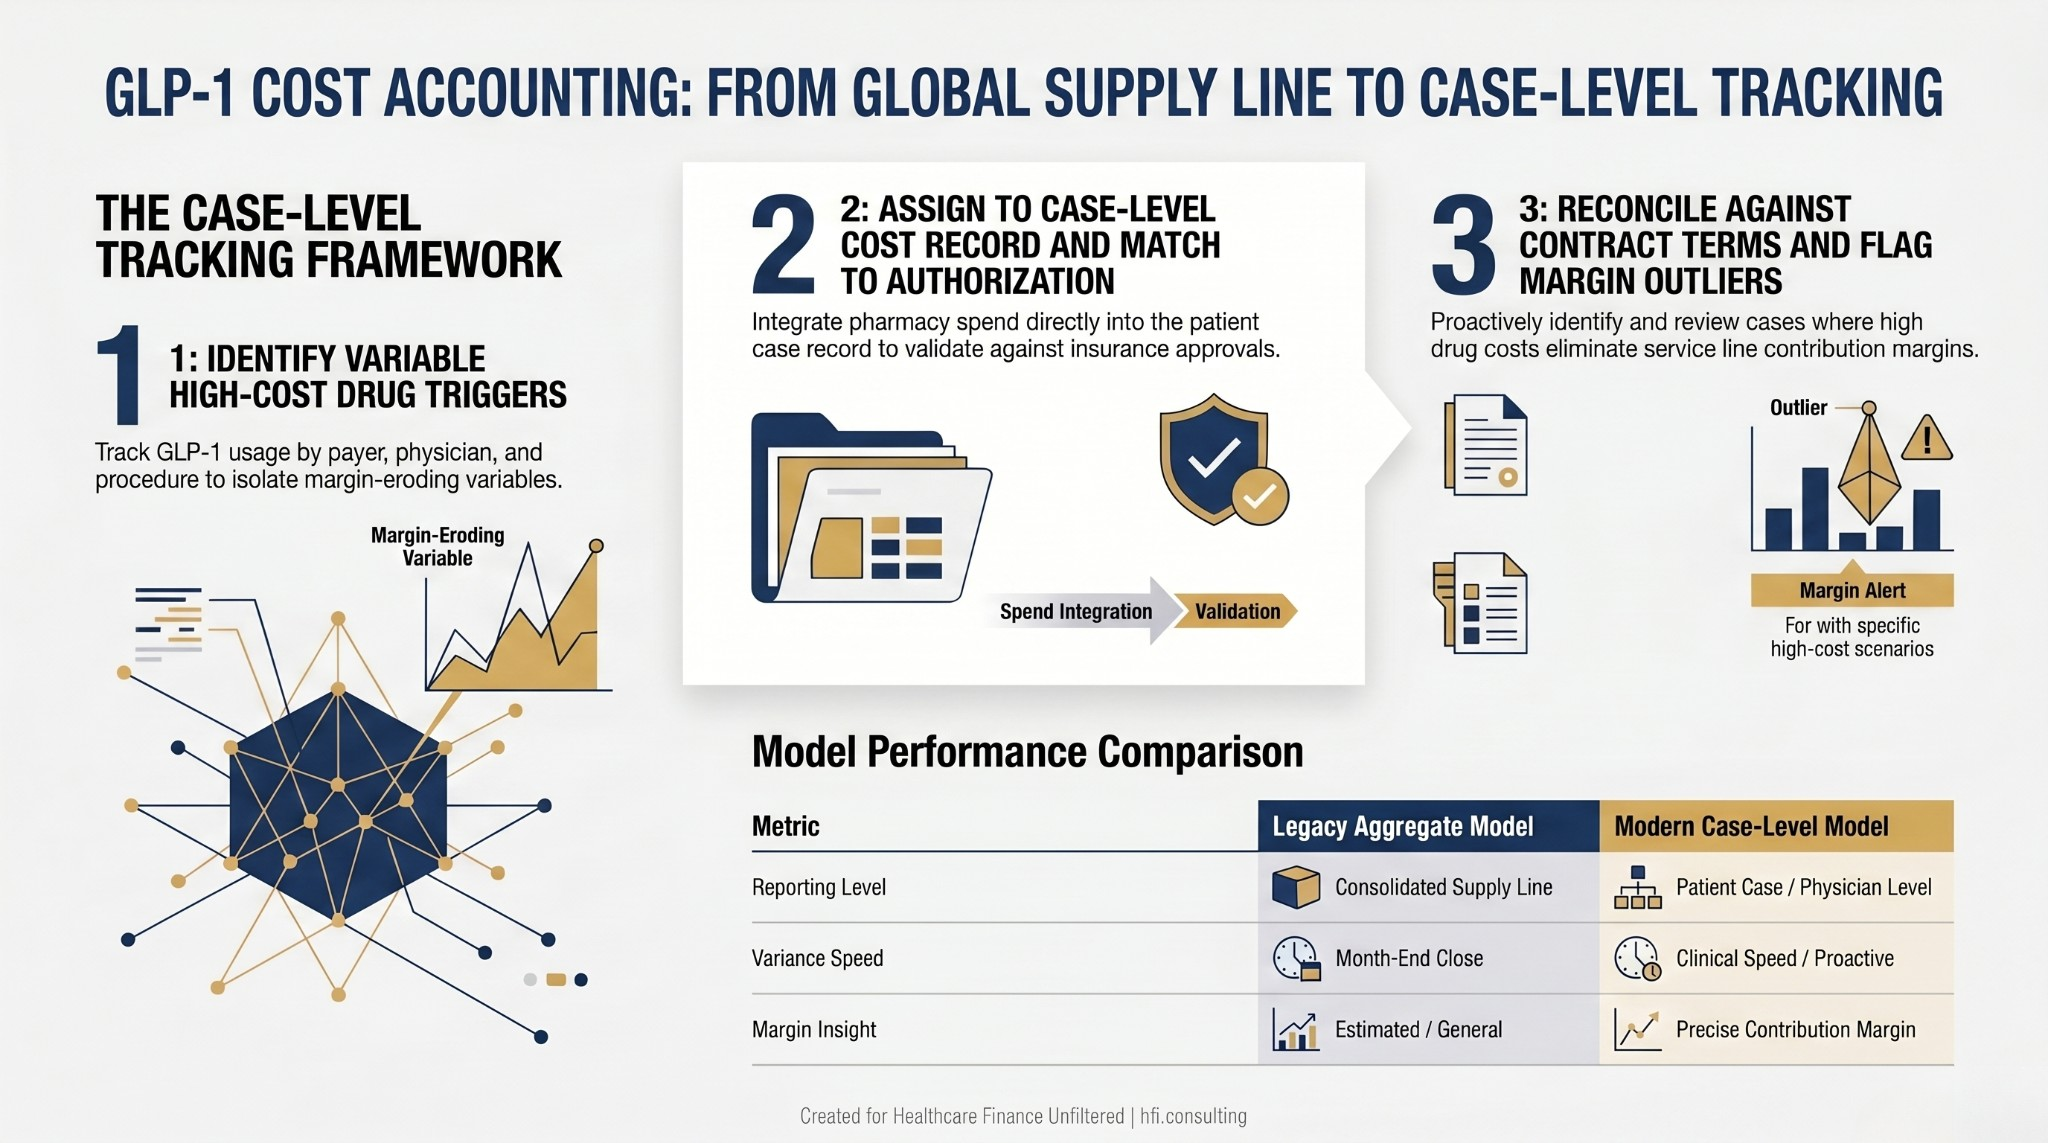
Three-step process flow diagram showing how CFOs can shift from aggregate pharmacy spend reporting to case-level GLP-1 cost tracking by payer and physician
2. Bridging the Outpatient Migration Gap
Between 2021 and 2024, outpatient revenue across the industry grew 31%. Operating margins fell 13% over the same period. That divergence is the central financial paradox of this moment.
Volume is moving to outpatient. Cost structures are not following.
The organizations trending toward distress moved cases to ambulatory and clinic settings without rebuilding the underlying cost architecture. Hospital-heavy labor models, facility cost allocations, and overhead structures designed for inpatient case mix do not translate to outpatient economics. If a procedure migrates to an ambulatory surgery center and the labor model stays unchanged, the margin typically does not hold.
The service line financial assessment framework goes deeper on how to stress-test the margin implications before a case mix shift happens. The diagnostic question here is simpler: run the math on contribution margin per constrained resource. Not total encounters. Not gross revenue. What does each unit of OR time, imaging slot, or high-cost resource actually return after variable costs?
CFOs running this calculation often find that the outpatient migration story presented to the board is accurate on volume and inaccurate on margin. The correction requires two separate conversations: a cost structure conversation with operations, and a reimbursement strategy conversation with managed care.
Congress is also moving toward site-neutral payment reforms that would reduce or eliminate facility fee differentials between hospital-based outpatient departments and independent clinics. If that happens, the margin cushion that has made outpatient migration tolerable for systems with high facility fees disappears. The CFOs scenario-planning for that outcome now will be ahead of the organizations scrambling to model it when the rule drops.
The benchmark worth building toward: a cost structure that is profitable at independent clinic reimbursement rates, not just hospital facility fee rates. That is a meaningful restructuring for most systems, and it takes time to execute.
3. Modular Capital Planning
Gibbins Advisors identified a recurring structural theme in 2025 and early 2026 bankruptcies: capital structures that do not work at current interest rates and operating margins. Large secured debt loads approved under assumptions that have since shifted are among the most consistent predictors of distress in the current filing data.
The antidote is not avoiding capital investment. Healthcare systems that stop investing fall behind on market share and quality, which compounds the financial problem. The antidote is staged capital commitment.
Stop approving projects as single, all-or-nothing capital requests. A $20 million outpatient expansion approved as a single line item carries full commitment risk regardless of how the first phase performs. The same investment structured in three stages—credential the provider and demonstrate volume, refurbish the space, then commit to high-cost equipment only when volume triggers are confirmed—limits downside exposure and preserves flexibility if the market shifts.
This matters particularly for technology-intensive service lines. Robotic surgery, advanced imaging, and AI-enabled diagnostic equipment all carry long acquisition timelines and significant capital commitments. If reimbursement changes materially before the investment is fully deployed, the organization that committed at the start absorbs the full risk. The organization that staged the investment has exit points.
The healthcare process automation investment framework applies a similar staged logic to technology capital decisions. The principle translates directly to clinical service line investment.
For CFOs preparing capital committee presentations this cycle, one question worth adding to your standard template: what happens to this project's NPV if commercial volume falls 20% in year three? If the answer is distress, the project needs a different structure, not a different assumption.

Vertical decision flowchart showing four CFO pre-approval checkpoints for capital projects including payer mix stress test and status quo NPV modeling requirements
If your organization is in the middle of a capital restructuring and needs a second set of eyes on the scenario analysis before it goes to committee, that is a core part of what HFI Consulting does. The work includes payer mix modeling, phased capital structuring, and margin analysis at the service line and case level. Visit hfi.consulting to connect.
4. The Payer Mix Stress Test
Medicare and Medicaid underpayments reached $130 billion in 2023 and were growing at 14% annually before the current round of Medicaid funding cuts accelerated the pressure further. For systems relying on commercial volume to cross-subsidize those losses, the math is becoming untenable.
The industry's structural response, consolidating market share and restricting network steering, is exactly what triggered the DOJ antitrust enforcement activity building throughout 2025 and 2026. The commercial cross-subsidization model is under pressure from two directions simultaneously: payer mix deterioration and regulatory constraint on the contracting behaviors that maintained it.
The dynamics between hospital pricing and insurer margins add additional context on how this squeeze is playing out at the contracting table. The bottom line for capital planning is simpler: the 60% commercial payer mix assumption that anchored a decade of pro formas is no longer a safe baseline.
The structural response available to CFOs is a conservative payer mix requirement for new capital approvals. Before any expansion advances to committee, require a pro forma that works at 35% commercial and 65% government payer mix. If the project fails that stress test, the question is not whether to approve it. The question is whether the cost structure, reimbursement strategy, or scope needs to change before approval.
Two additional moves belong in every 2027 planning cycle.
Model the status quo NPV. The cost of not investing, including market share erosion, physician outmigration, and aging infrastructure, is frequently higher than the capital request on the table. That calculation almost never appears in committee materials. It should.
Use claims data to map patient out-migration. Patients who leave the network after an initial encounter represent recoverable revenue that is nearly always cheaper to retain than new patients to acquire. Systems that have done this analysis consistently find that recovering 25 to 30% of out-migration leakage produces better margin than equivalent new patient volume.
The Bottom Line
Bankruptcy in healthcare is rarely caused by the wrong service line or the wrong market. It is caused by unexplained margin gaps that accumulate over time, in categories that finance teams were not watching at the right level of granularity.
The organizations that navigate 2027 will be the ones that built case-level cost visibility before they needed it. They adjusted cost structures when volume migrated rather than after absorbing the shock. They staged capital commitments to preserve flexibility when market assumptions shifted. They stress-tested payer mix before approving expansion rather than after the commercial volume didn't materialize.
The analytical scaffolding that separates those organizations from the ones Gibbins Advisors is tracking is not proprietary technology. It is finance infrastructure built in the months before distress, not during it.
If your organization is working through any of these frameworks, including case-level pharmacy cost accounting, outpatient margin analysis, capital structure stress testing, or payer mix scenario planning, HFI Consulting works with CFOs and finance teams on exactly this kind of structural work. Visit hfi.consulting to start the conversation.
P.S. Which of the four pressure points in this article is hitting your organization hardest right now: pharmacy cost tracking, outpatient margin erosion, capital structure, or payer mix? Hit reply and tell me. The answers shape what I cover next.
