
Implant Costs Are a Contribution Margin Problem, Not a Billing Problem: A CFO Action Guide for Hospitals and ASCs
When device pricing drifts from your vendor contract, the damage lands in your service line P&L — not your billing queue.
Your orthopedic service line may be reporting a positive contribution margin. That does not mean it is healthy.
If your implant costs are loaded incorrectly into the chargemaster, misaligned with vendor contract schedules, or captured through a sticker-based tracking system, the damage does not show up as a billing error. It shows up as a margin problem that finance leadership cannot explain — and clinical leadership will not own.
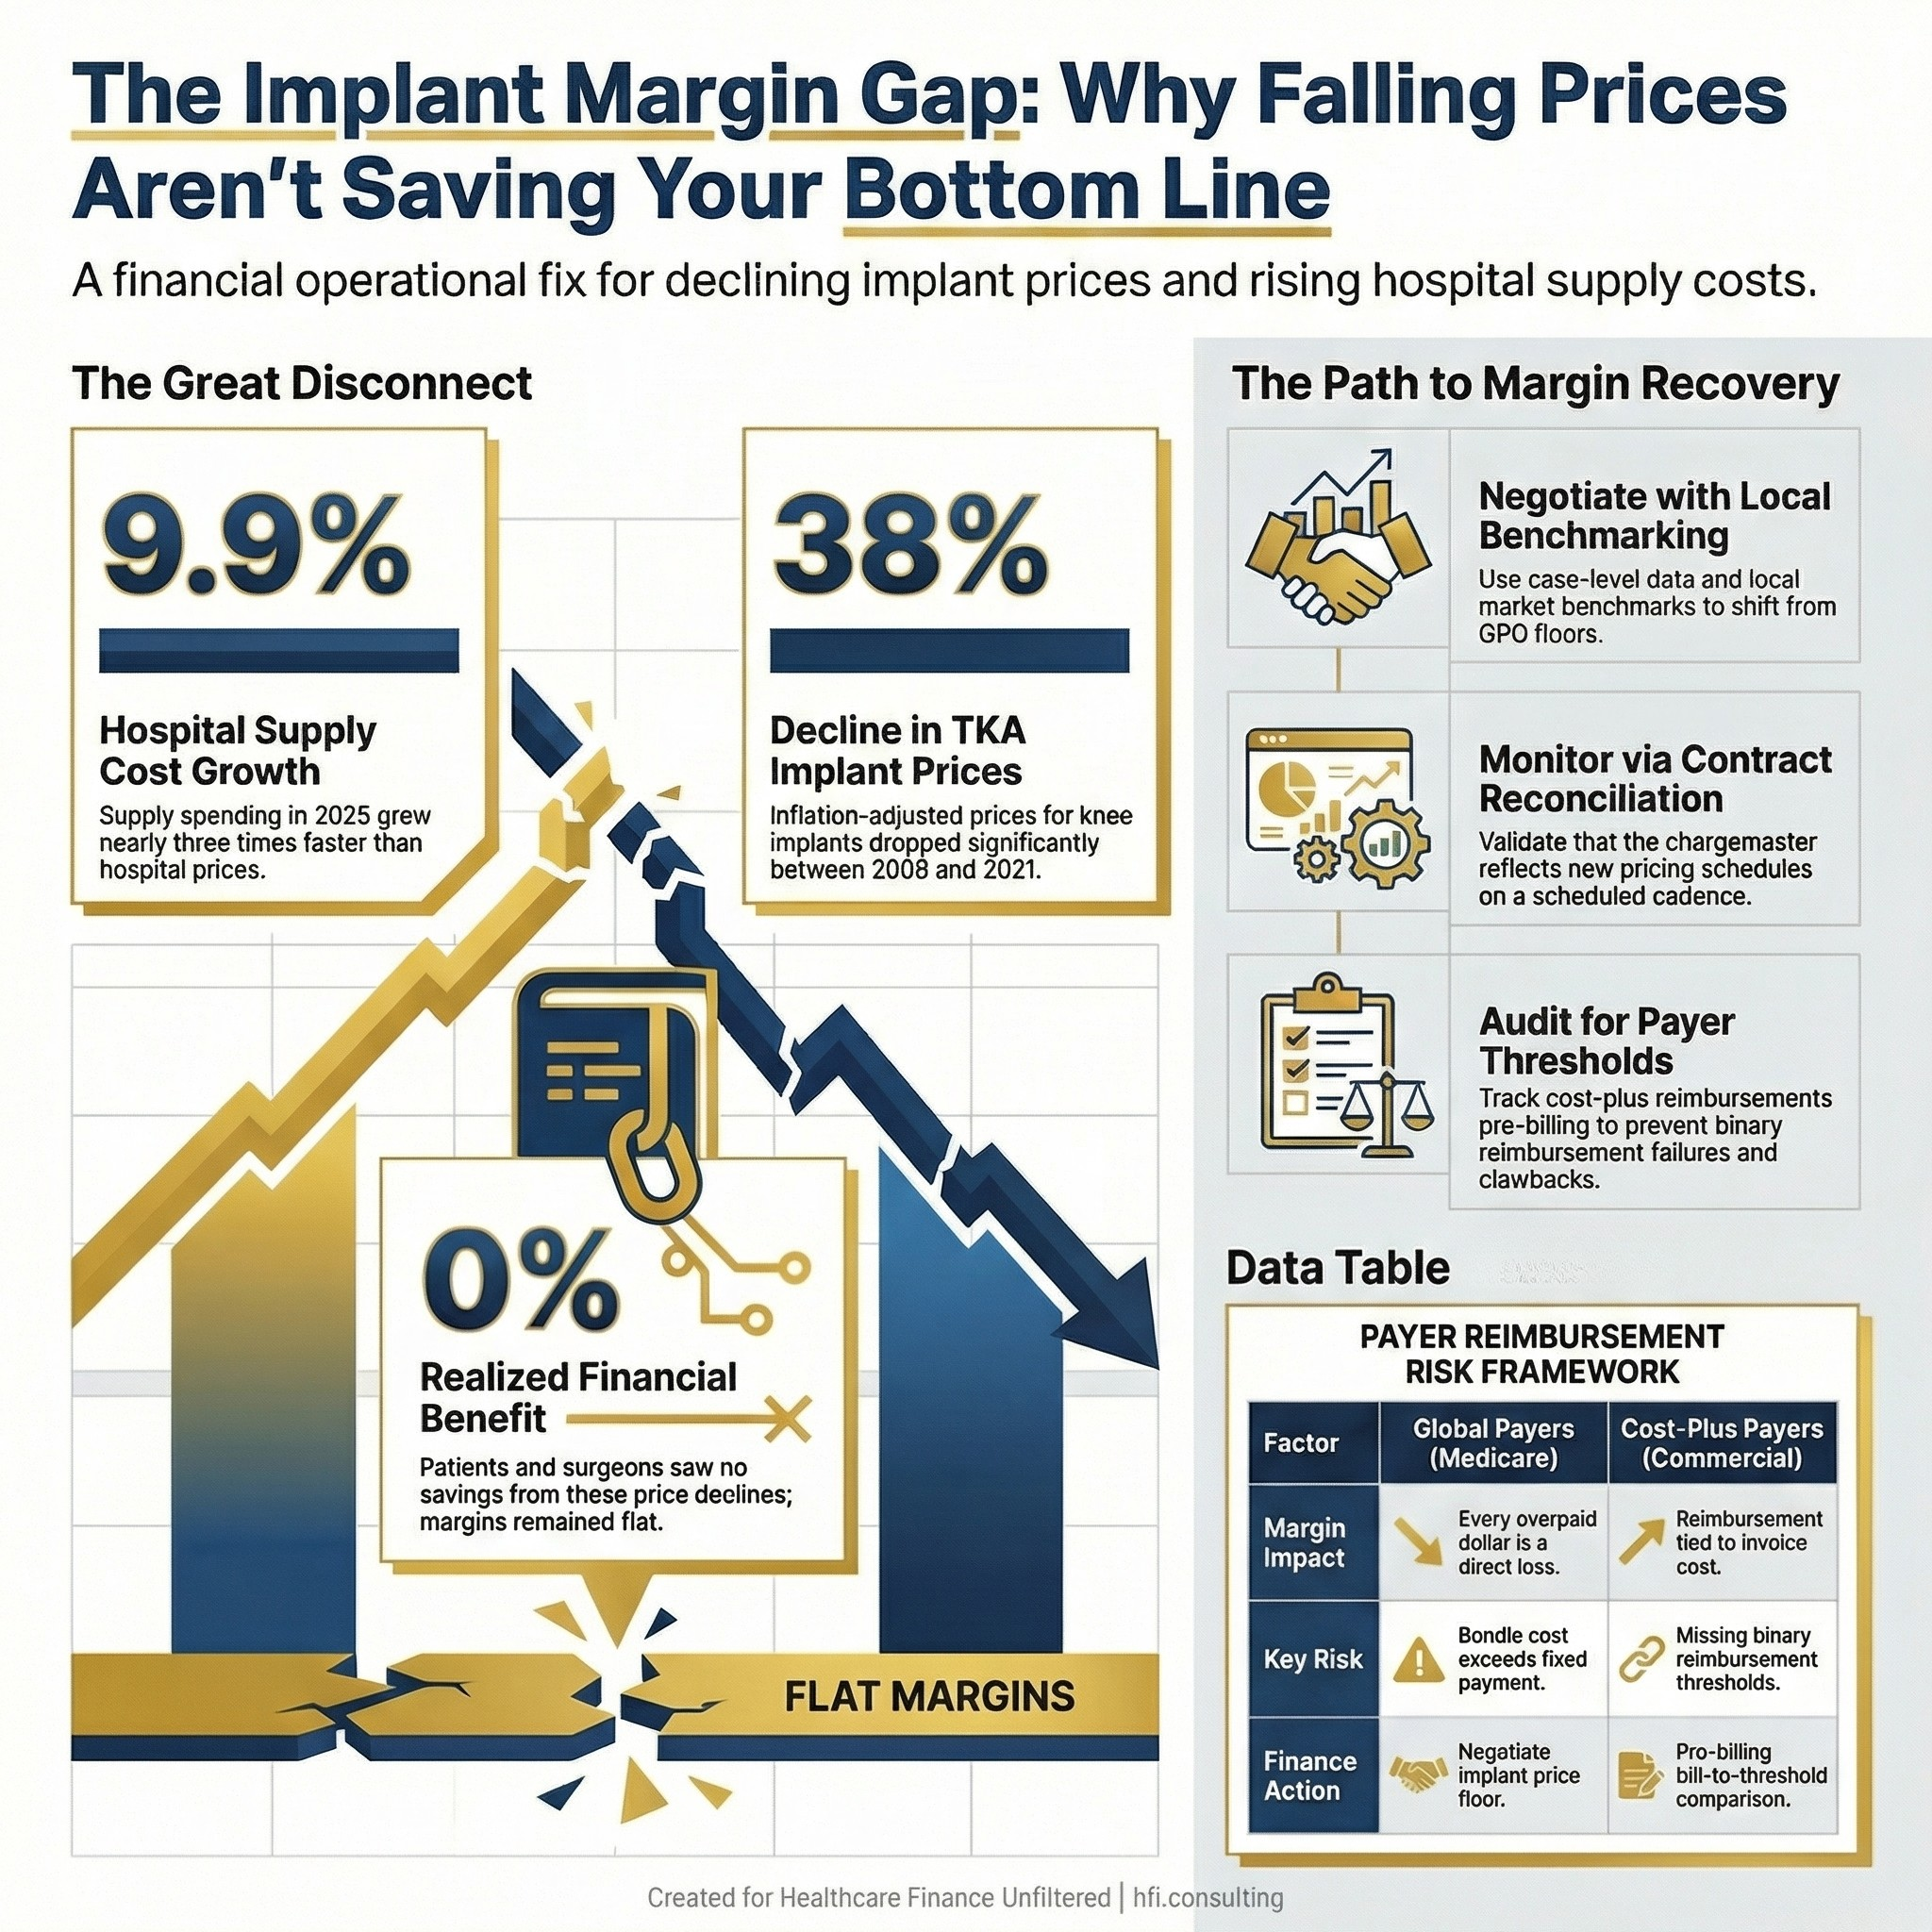
Three-panel stat card showing hospital supply cost growth, implant price decline, and the disconnect between pricing trends and realized savings.
The Problem Finance Leaders Are Not Framing Correctly
The American Hospital Association's 2026 Costs of Caring report documented that total hospital supply spending grew 9.9% in 2025 — nearly three times the rate of growth in hospital prices. Supplies now represent 18% of total hospital expenses, sitting behind only labor.
What the AHA report does not isolate — but what every CFO running surgical service lines needs to internalize — is that implants are not just a supply line item. They are a variable cost that moves case-by-case, surgeon-by-surgeon, and payer-by-payer. Aggregate supply cost tracking masks all of that variation. The facilities that cannot explain their implant cost at the case level are running contribution margin calculations on assumptions that no longer reflect operational reality. This is a broader problem than implant costs alone.
A 2026 study published in the Journal of Arthroplasty analyzed 629,651 total joint arthroplasty procedures and found that inflation-adjusted implant prices for total knee and hip arthroplasty declined 37–38% between 2009 and 2021. That is a meaningful price improvement. The study also found that neither patients nor surgeons realized the financial benefit of those declines. Hospital total costs and reimbursements remained essentially flat.
The margin should have improved. It did not. That gap belongs to finance leadership to explain and close.
Why Implant Costs Destroy Contribution Margin Silently
There are three mechanisms by which implant cost problems become margin problems rather than billing problems. Understanding the distinction matters for how you prioritize your operational response.
Mechanism 1: Chargemaster misalignment
When an implant is used in a procedure, it needs a corresponding charge loaded in the chargemaster at the correct level. If the charge is stale, understated, or coded to the wrong CPT, one of two things happens. On global-rate payers like Medicare — where implant costs are bundled into a capitated procedural payment — the facility absorbs 100% of the cost with no recovery path. On cost-plus payers — where the insurer reimburses actual invoice cost — the facility may be billing below what it can legitimately recover.
Both scenarios destroy the contribution margin. Neither triggers a denial.
Mechanism 2: Vendor contract drift
Implant vendor contracts are renegotiated periodically, but the pricing schedules within those contracts can change on add-on items, associated disposables, and specialty configurations without triggering a formal contract amendment. If the cost accounting system or the chargemaster is not updated to reflect those changes, the facility is operating on pricing assumptions that no longer match reality.
I have seen this pattern repeatedly across multi-hospital systems. In my work supporting analytics implementations through McKesson (now Change Healthcare), the facilities that had clean implant cost data were the exception, not the rule. Most were running contribution margin calculations on variable cost assumptions that were six to eighteen months out of date.
Mechanism 3: Point-of-care capture failure
Manual and sticker-based tracking systems — still in use at many facilities — fail to accurately capture what was opened, what was implanted, and what was returned. Implants that are opened but not used frequently disappear from the financial record. Inventory that is wasted is not accounted for. The result is a cost basis that understates actual variable cost per case while also forfeiting any reimbursement opportunity on items that were legitimately billable.
According to research from IDENTI Medical, orthopedic implants can represent up to 30% of a hospital's overall supply budget. When that spend is aggregated and manually tracked, the true cost per procedure is opaque to everyone in the finance function.
The Payer Reimbursement Structure Every CFO Must Understand
Implant cost strategy looks different depending on your payer mix, and most CFOs are managing a roughly 50/50 split between global and cost-plus payers — though the actual mix varies significantly by market, geography, and patient population.
Global payers (Medicare and many commercial contracts): Implant costs are bundled into the procedure rate. The facility receives a fixed payment regardless of what the device costs. This means every dollar you overpay a vendor is a dollar of direct margin loss. Negotiating implant price down on global-rate procedures is non-negotiable from a margin standpoint.
Cost-plus payers: The insurer reimburses the facility based on actual invoice cost, sometimes with an additional markup of 5–10%. On the surface, this looks like a pass-through. It is not. If your billing captures a cost of $995 against a payer contract with a $1,000 reimbursement threshold, you receive zero reimbursement — not $995. The threshold is binary. Missing it by $5 has the same financial impact as missing it by $500.
Payers also use post-authorization clawback mechanisms to recover implant payments when documentation is incomplete. Pre-authorization gaps, incorrect CPT codes, and missing item-level documentation all create clawback risk that does not show up until the remittance arrives weeks after the procedure.
For ASCs in particular, these dynamics are acute. A 2025 Advantien report noted that implants regularly represent one of the highest expense items for ASCs and can sometimes exceed total reimbursement for a procedure. That is a case-level contribution margin that is negative before a single staff member walks into the OR.
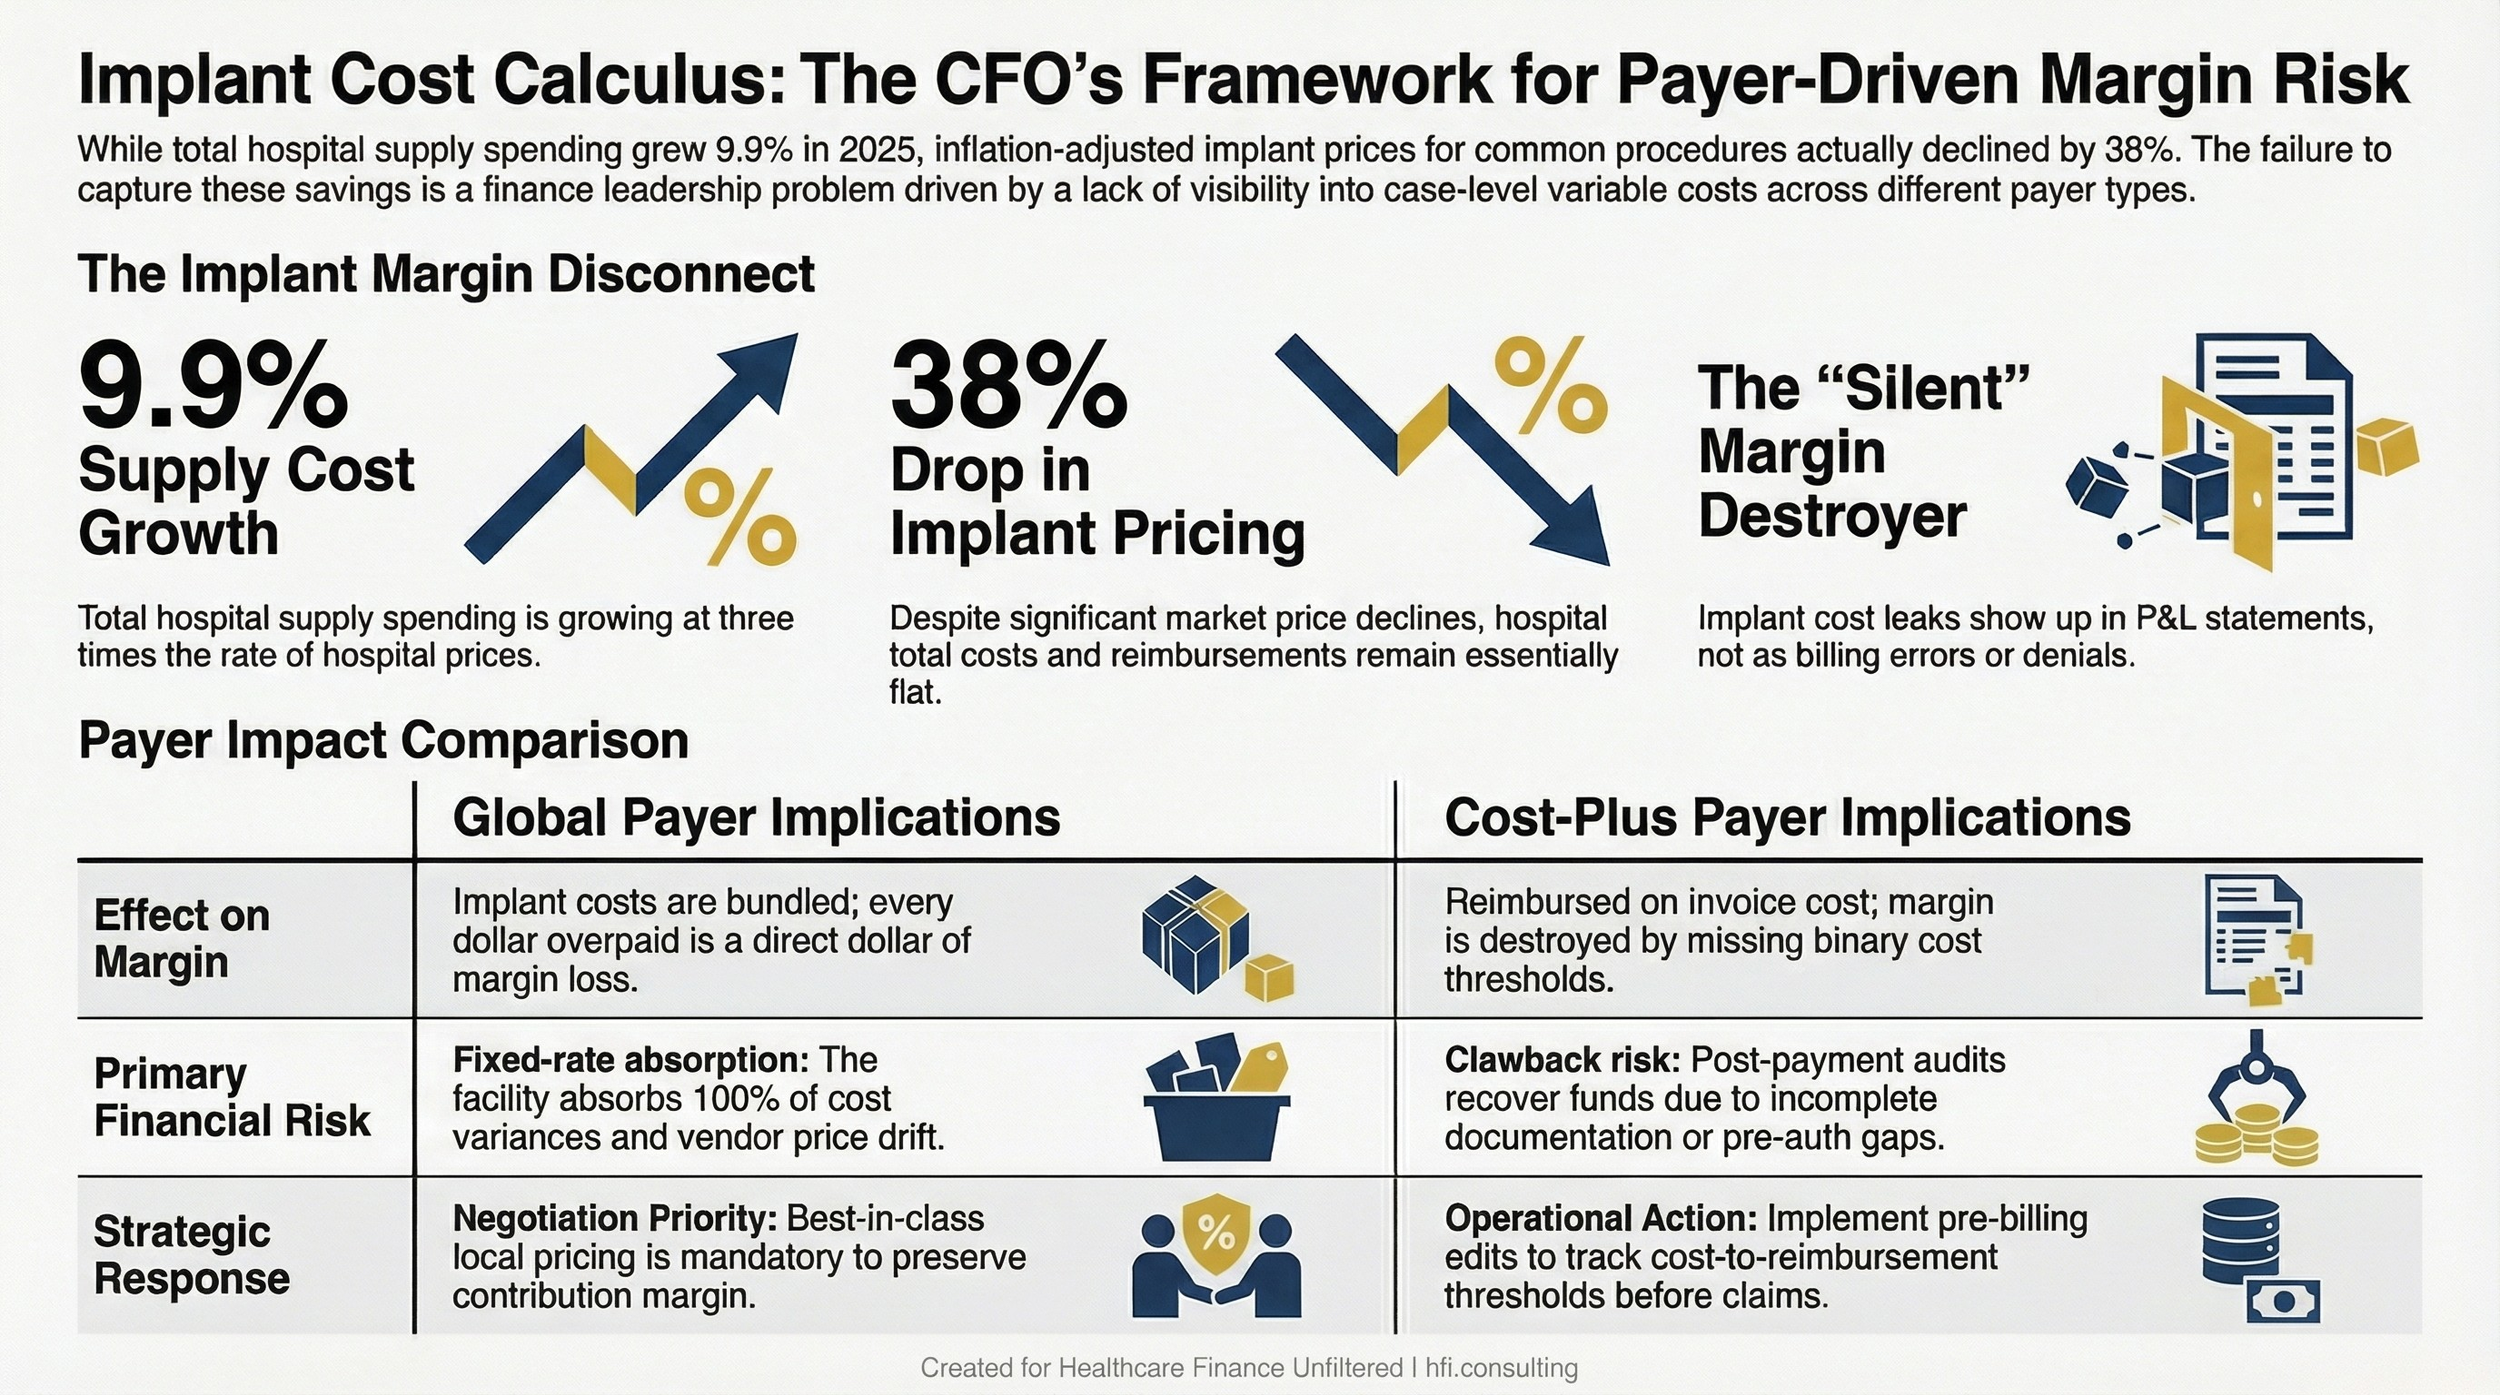
Side-by-side comparison table showing how global and cost-plus payer structures create different implant cost risks for hospital and ASC finance teams.
The Negotiation Framework: What Actually Works
National benchmarking data from GPOs and services like Strata or Equity provide an average price. That average is a starting point, not a target. The facilities that consistently achieve best-in-class implant pricing negotiate locally, use case-level data, and engage the surgeon as a financial partner rather than a clinical end-user.
Here is a sequence that works.
Step 1: Extract and clean your raw implant purchase data. Most facilities running HST, NV, or Epic have the raw data in the system. The problem is it is rarely summarized into a format that supports a negotiation conversation. Pull the data by implant type, by procedure, by CPT code, and by surgeon. Calculate cost per case. Calculate cost as a percentage of reimbursement by payer type. This is the foundational document for every conversation that follows.
Step 2: Layer in local benchmarking. National average pricing from a GPO gives you a floor. What you need is locally negotiated competitive pricing for your market. There are third-party services that provide this data. The local benchmark is what shifts the negotiation from subjective to evidence-based. When a rep tells you they are offering the best price in the country, the right response is a comparison to what comparable facilities in your region are paying.
Step 3: Bring the surgeon into the conversation with data, not directives. In ASC settings especially, surgeons are equity owners. They have financial skin in the outcome. Presenting the data — this is what we pay per case, this is what comparable facilities pay, this is the margin impact — reframes the negotiation from an administrative request to a shared business problem.
When I managed financial operations across seven hospitals at Ascension, the service line conversations that moved fastest were the ones where we had data the surgeons had not seen before. Surgeons respond to evidence. The surgeon-vendor relationship is a real dynamic, and it does not dissolve under a top-down mandate. It shifts when the surgeon has a clear picture of the financial impact and can engage their vendor contact directly.
Step 4: Identify the disposable picture. Implant negotiation often focuses on the device itself and misses the associated disposables that add cost to every case. The total case cost is the relevant number, not the line-item device cost. Disposables should be included in the benchmarking and the negotiation scope.
Step 5: Build volume-leverage into the contract. Vendors offer rebates and volume-based discounts. If your facility is distributing volume across multiple vendors with no formal commitment structure, you are likely leaving discount potential on the table. Consolidation is not always clinically appropriate, but where it is, formalizing the volume commitment creates a different contract conversation.
Building the Alert System Your Finance Team Is Missing
Negotiating a good contract is the beginning, not the end. The gap between contracted price and actual billed cost is where margin leakage lives in steady state.
Your finance team needs three operational controls to prevent contract drift from becoming a chronic margin problem.
Control 1: Contract-to-chargemaster reconciliation on a scheduled cadence. Every time a vendor contract is renewed, amended, or extended, someone in finance should be responsible for validating that the chargemaster reflects the new pricing schedule. This should be a formal sign-off process, not an assumption that clinical operations handled it. In practice, contract amendments happen on the vendor's timeline and are communicated through the sales rep. By the time finance sees the new pricing, it may have been in use for months.
Control 2: Case-level cost variance reports for high-spend service lines. If your cost accounting system can produce a cost-per-case report broken down by variable cost category, set a threshold for implant cost variance by procedure. Cases where implant cost exceeds the expected range by more than a defined percentage should generate an exception report. This is a standard cost accounting tool that is underused in surgical service lines because most facilities do not have clean enough cost-to-case data to run it reliably.
Control 3: Payer contract threshold tracking. For cost-plus payers with reimbursement thresholds, someone in revenue cycle needs to be running a bill-to-threshold comparison before claims go out. This is a pre-billing edit, not a post-denial recovery function. If your RCM team is catching these issues on the back end, you are already losing money.
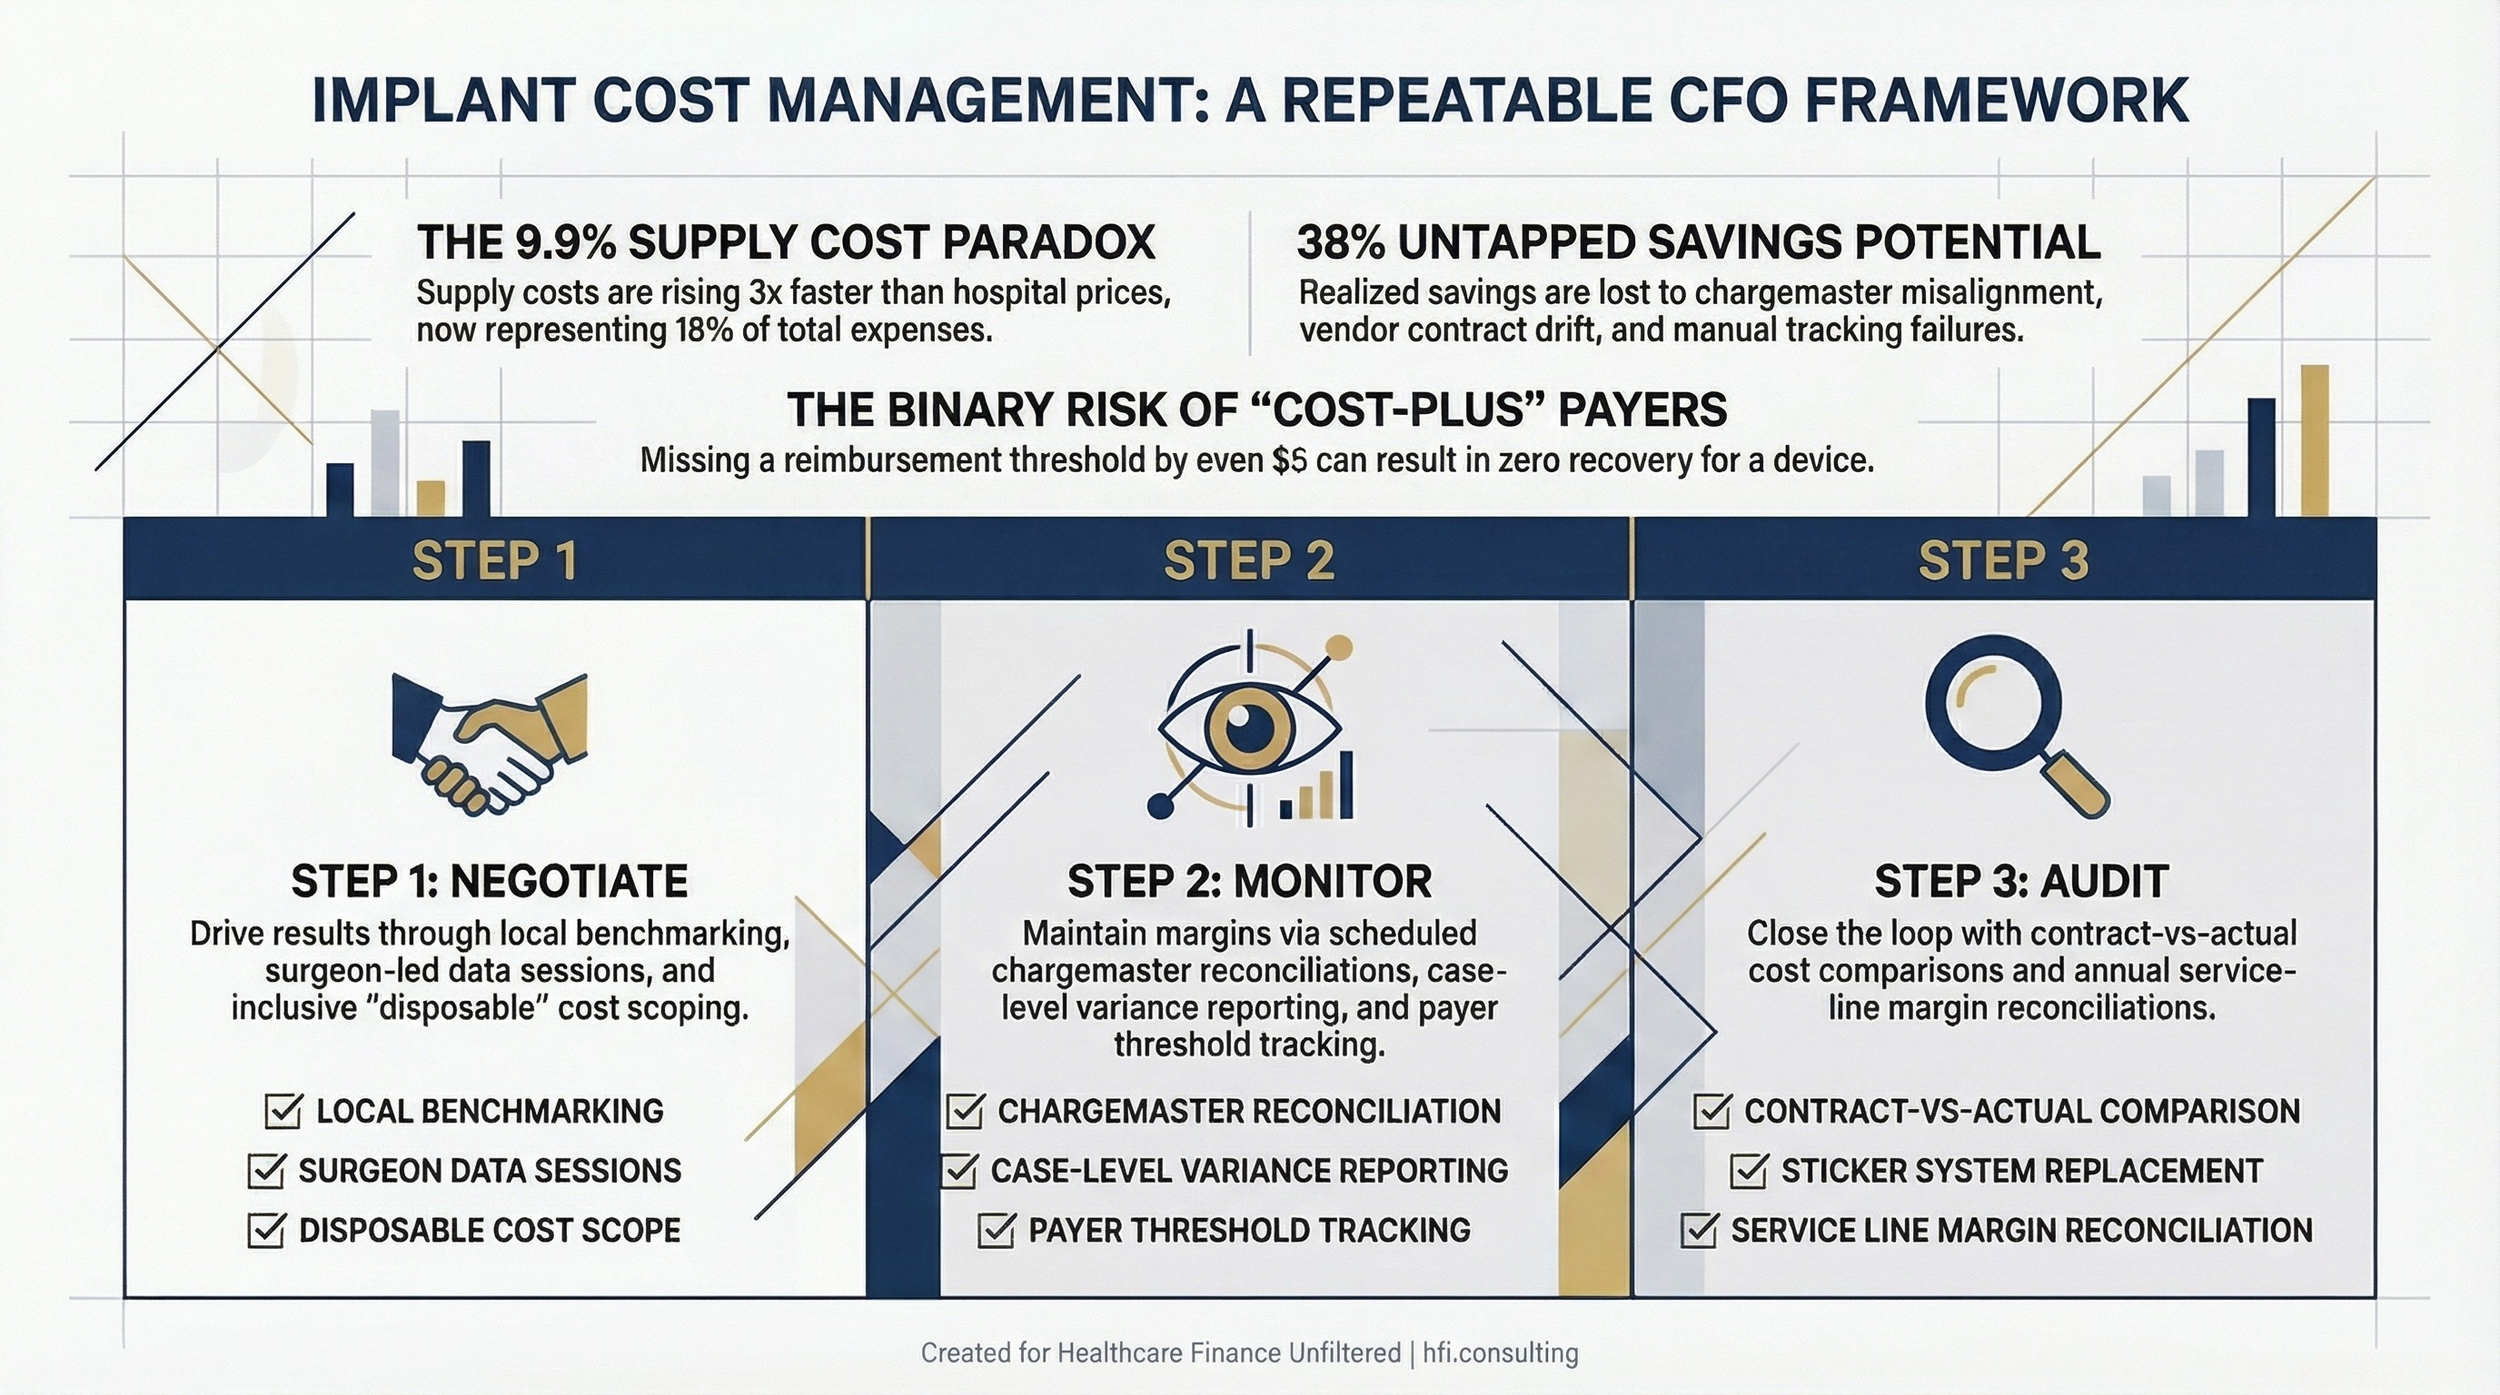
Three-column framework showing negotiate, monitor, and audit steps for managing implant cost leakage in hospital and ASC settings.
When the Problem Is Already Embedded in Your Financials
If your orthopedic or spine service line has contribution margins that look reasonable in aggregate but cannot be explained at the case level, you may already have implant cost problems embedded in your financial statements.
The signals are not always obvious. A service line that is running slightly below benchmark contribution margin — 200 to 400 basis points below peer facilities — does not automatically trigger an investigation. It gets attributed to payer mix, case complexity, or volume. The implant cost dimension gets overlooked because the cost accounting system is not producing reliable case-level variable cost data.
The right diagnostic is a case-level cost-to-reimbursement analysis across your highest-volume surgical procedures, broken out by payer type and sorted by implant cost as a percentage of total variable cost. If you run that analysis and find cases where implant cost exceeds 30–40% of total variable cost, you have a data integrity problem, a contract problem, or both.
In my experience doing cost accounting at UF Health Jacksonville, we were constantly working to reconcile aggregate supply costs to procedure-level actuals. The cases where the math did not work — where the cost per case was materially higher than the benchmark without a clinical explanation — were almost always implant-related. Either the cost was loaded incorrectly, the charge was not captured at the point of care, or a vendor had adjusted pricing and no one had updated the system.
That is the diagnostic conversation your finance team needs to be able to have with surgical leadership. Not "your costs are too high" but "here is where the data breaks down and here is what we cannot explain."
If your surgical service lines have contribution margins that do not reconcile at the case level, the problem is almost always upstream of billing. I work with CFOs and service line leaders to identify where implant cost data is breaking down and build the operational controls to prevent it from recurring. If you want to talk through what a targeted implant cost audit would look like for your facility, reply to this email or visit hfi.consulting to connect directly.
The Audit Trigger Checklist
Not every facility needs an external audit. Some need a process fix. Some need a data infrastructure upgrade. Some need all three.
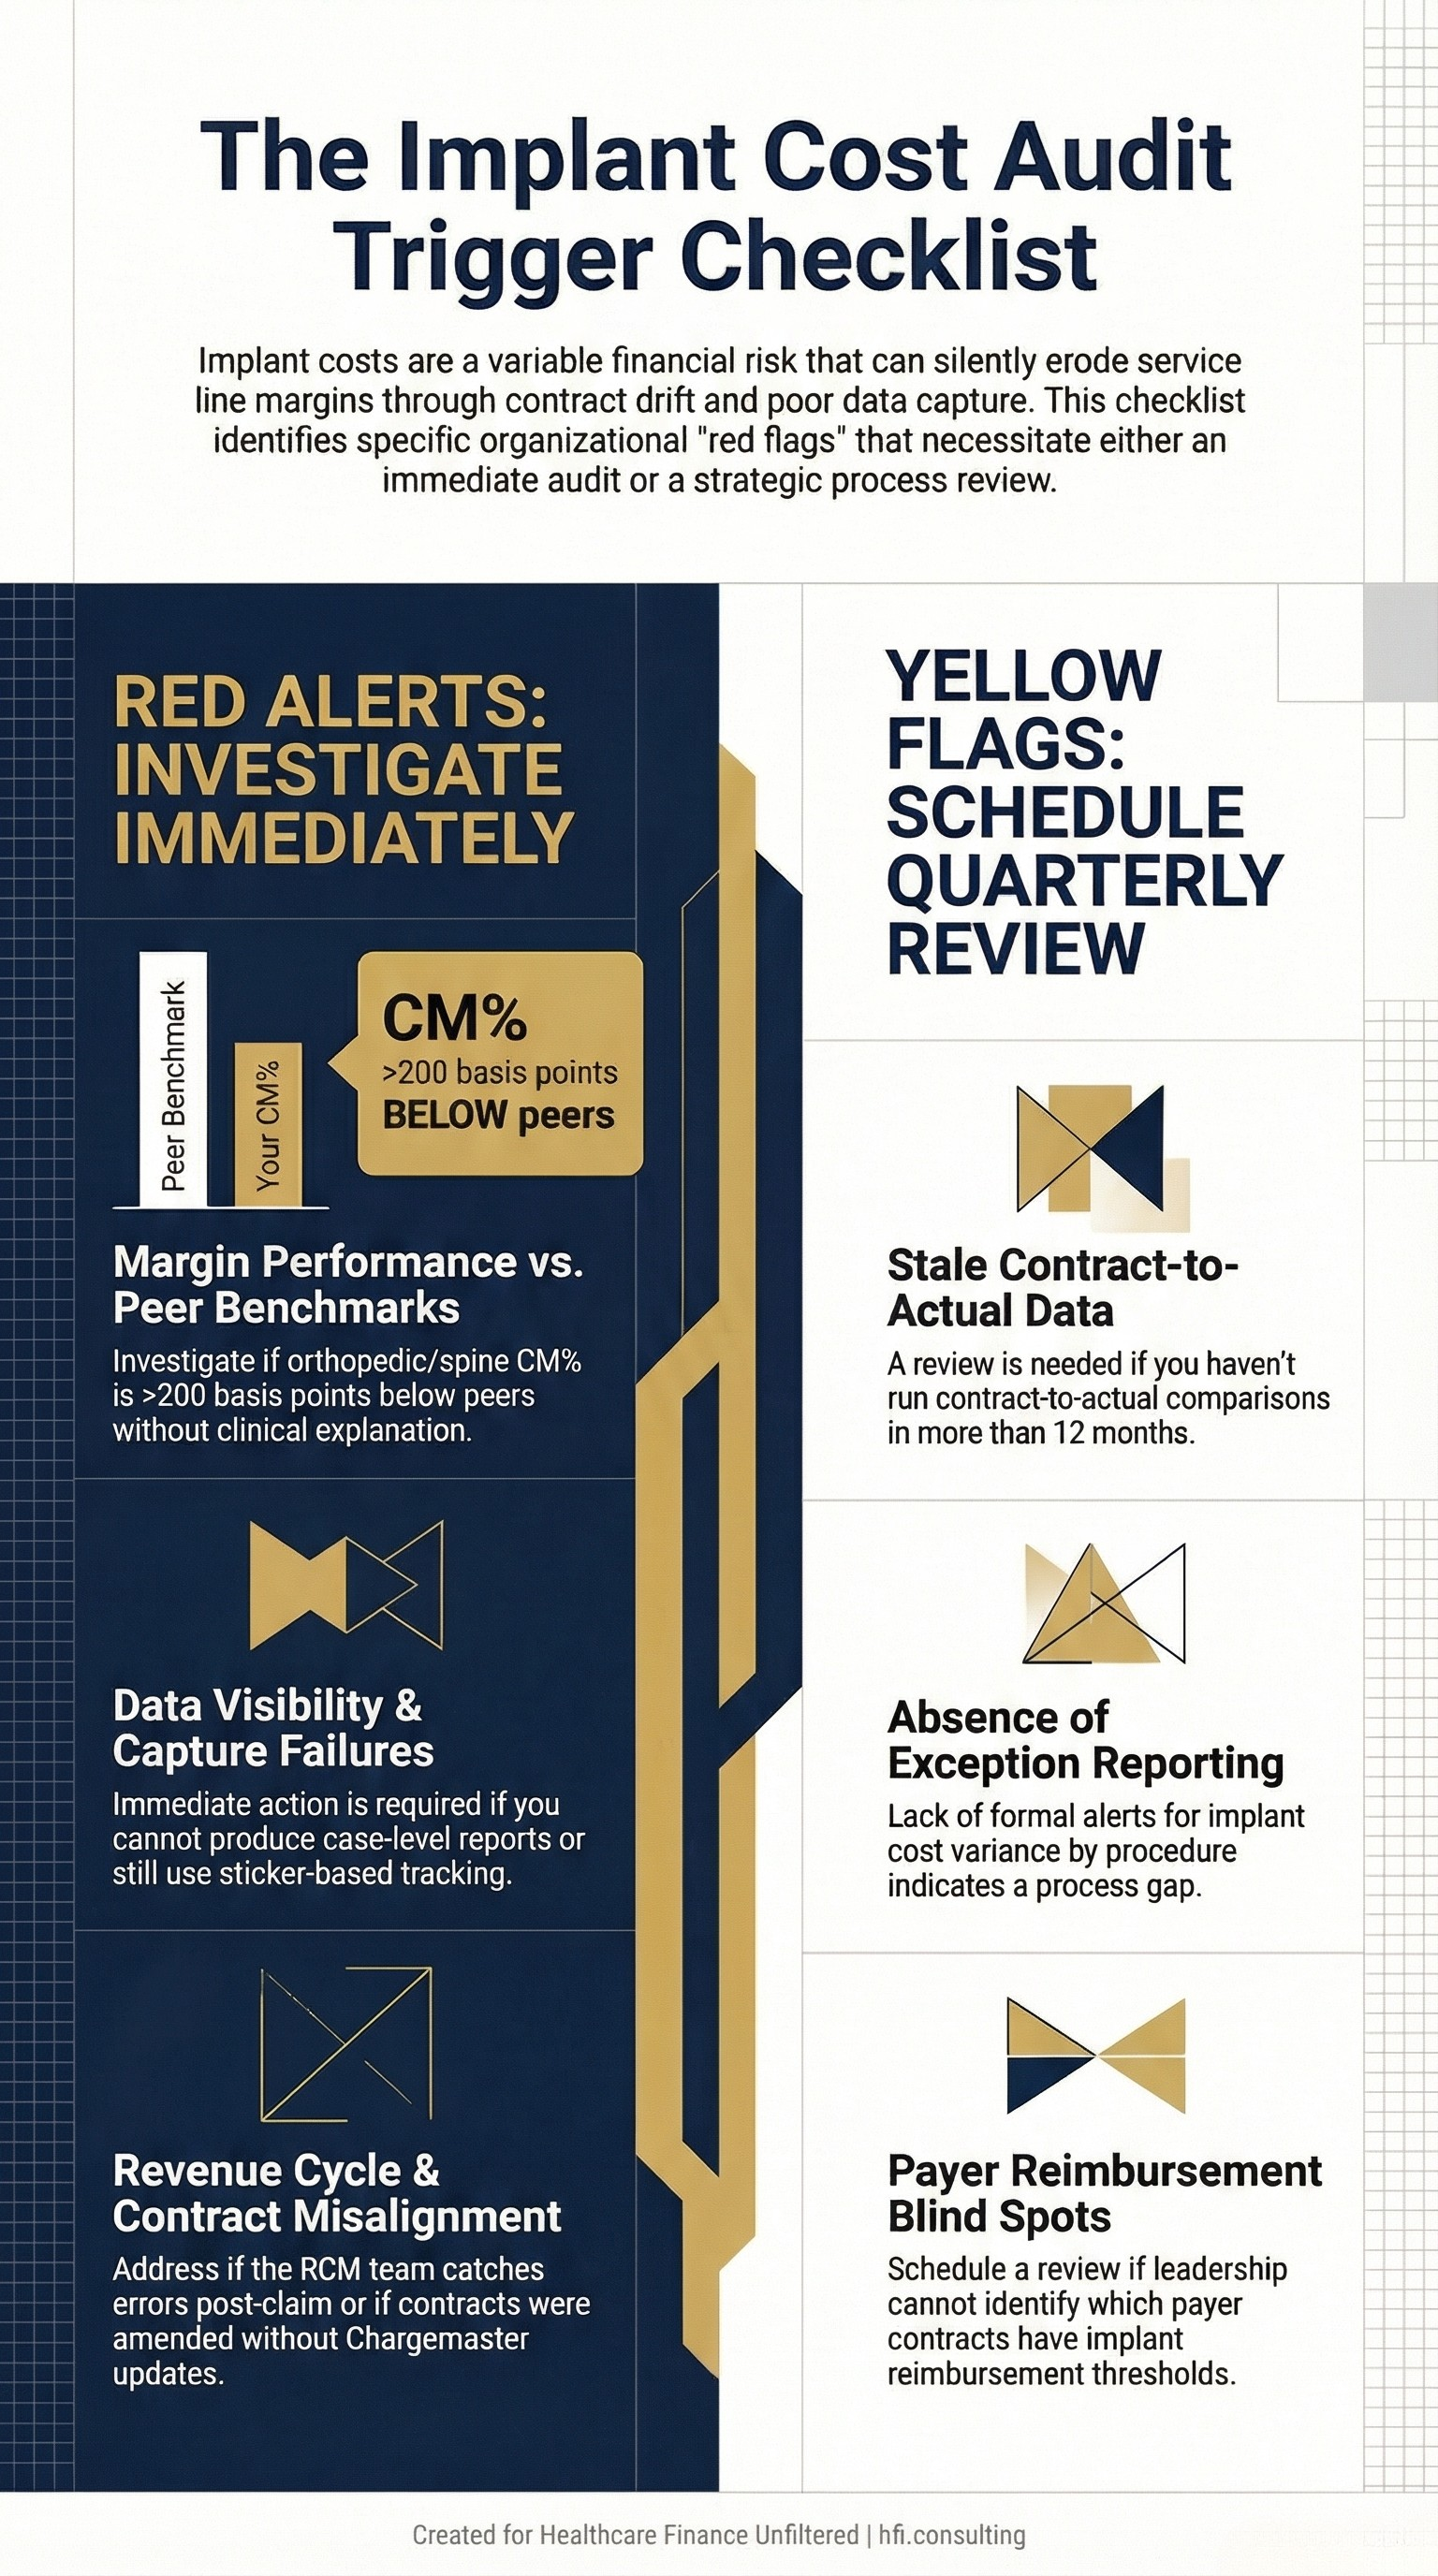
Use the following triggers to assess how urgent the implant cost problem is in your organization.
You should investigate immediately if:
Your orthopedic or spine service line CM% is more than 200 basis points below peer benchmark without a documented clinical explanation
You cannot produce a case-level cost report by CPT code and implant type from your cost accounting system
Your chargemaster has not been reconciled against vendor contracts in the past six months
Your RCM team is catching implant billing errors post-claim rather than pre-billing
A vendor contract was renewed or amended in the last twelve months without a corresponding chargemaster update
You are still using sticker-based or manual capture systems for implant usage at point of care
You should schedule a process review within the next quarter if:
You have clean cost data but have not run a contract-to-actual comparison in more than twelve months
You do not have a formal alert or exception report for implant cost variance by procedure
Your surgical service line leadership cannot tell you which payer contracts have implant reimbursement thresholds
What This Means for Payer-Side Finance Leaders
This issue is not exclusively a provider problem. For payers administering cost-plus implant reimbursement contracts, the same data integrity gaps that cause providers to underbill also create opportunities for overbilling when internal controls are weak.
Implant billing audits and cost-plus claim reviews are a legitimate tool for payer cost containment — but they are most effective when the payer has a clear understanding of what contracted pricing should look like for their network providers. If your cost-plus contracts do not include mechanism for price validation against vendor invoices, the overbilling risk is real in both directions.
For Medicare Advantage plans specifically, implant cost is bundled into procedure rates. The financial exposure is not on the implant line; it is on the medical necessity and authorization side. MA plans that are seeing high surgical volume with incomplete authorization documentation should include implant capture adequacy in their post-payment audit scope.
The Bottom Line for CFOs
Implant cost management is not a supply chain problem or a billing problem. It is a financial operations problem that sits at the intersection of vendor contracts, cost accounting infrastructure, payer contract terms, and point-of-care data integrity.
The facilities that manage it well are doing a few things consistently: they have clean case-level cost data, they negotiate locally rather than defaulting to GPO pricing, they engage their surgeons with financial evidence rather than administrative directives, and they maintain a reconciliation cadence that catches contract drift before it compounds into a service line margin problem.
The AHA's 2026 Costs of Caring report documented supply cost growth of 9.9% in 2025. That number will continue to climb. The facilities that cannot explain their implant cost at the case level will not be able to manage it — and the impact will keep appearing as an unexplained margin gap no one can attribute and no one wants to own.
That gap belongs to finance leadership to close.
Healthcare Finance Unfiltered covers the operational and financial strategy issues that do not fit neatly into industry talking points. If this was useful, subscribe to get new articles directly to your inbox. And if you are working through a service line margin problem that has an implant cost component, visit hfi.consulting to learn how I work with provider and payer finance teams on targeted cost and revenue audits.
P.S. For the CFOs reading this: what does your current process look like for catching vendor contract drift before it hits your contribution margin reports? Is someone in finance doing that reconciliation proactively, or is the variance showing up in the monthly variance review with no clear explanation? Hit reply and tell me where the breakdown is happening in your organization.