
Service Line Financial Assessment: The CFO's Framework for Capital Decisions That Actually Hold Up
When volume growth no longer guarantees margin growth, finance leaders need a sharper lens for service line investment decisions.
Hospital inpatient revenue grew 13% between 2021 and 2024. Outpatient revenue grew 31%. Operating margins fell 13% over that same period. If your service line investment strategy still rests on volume projections alone, you are making capital decisions with the wrong instrument.
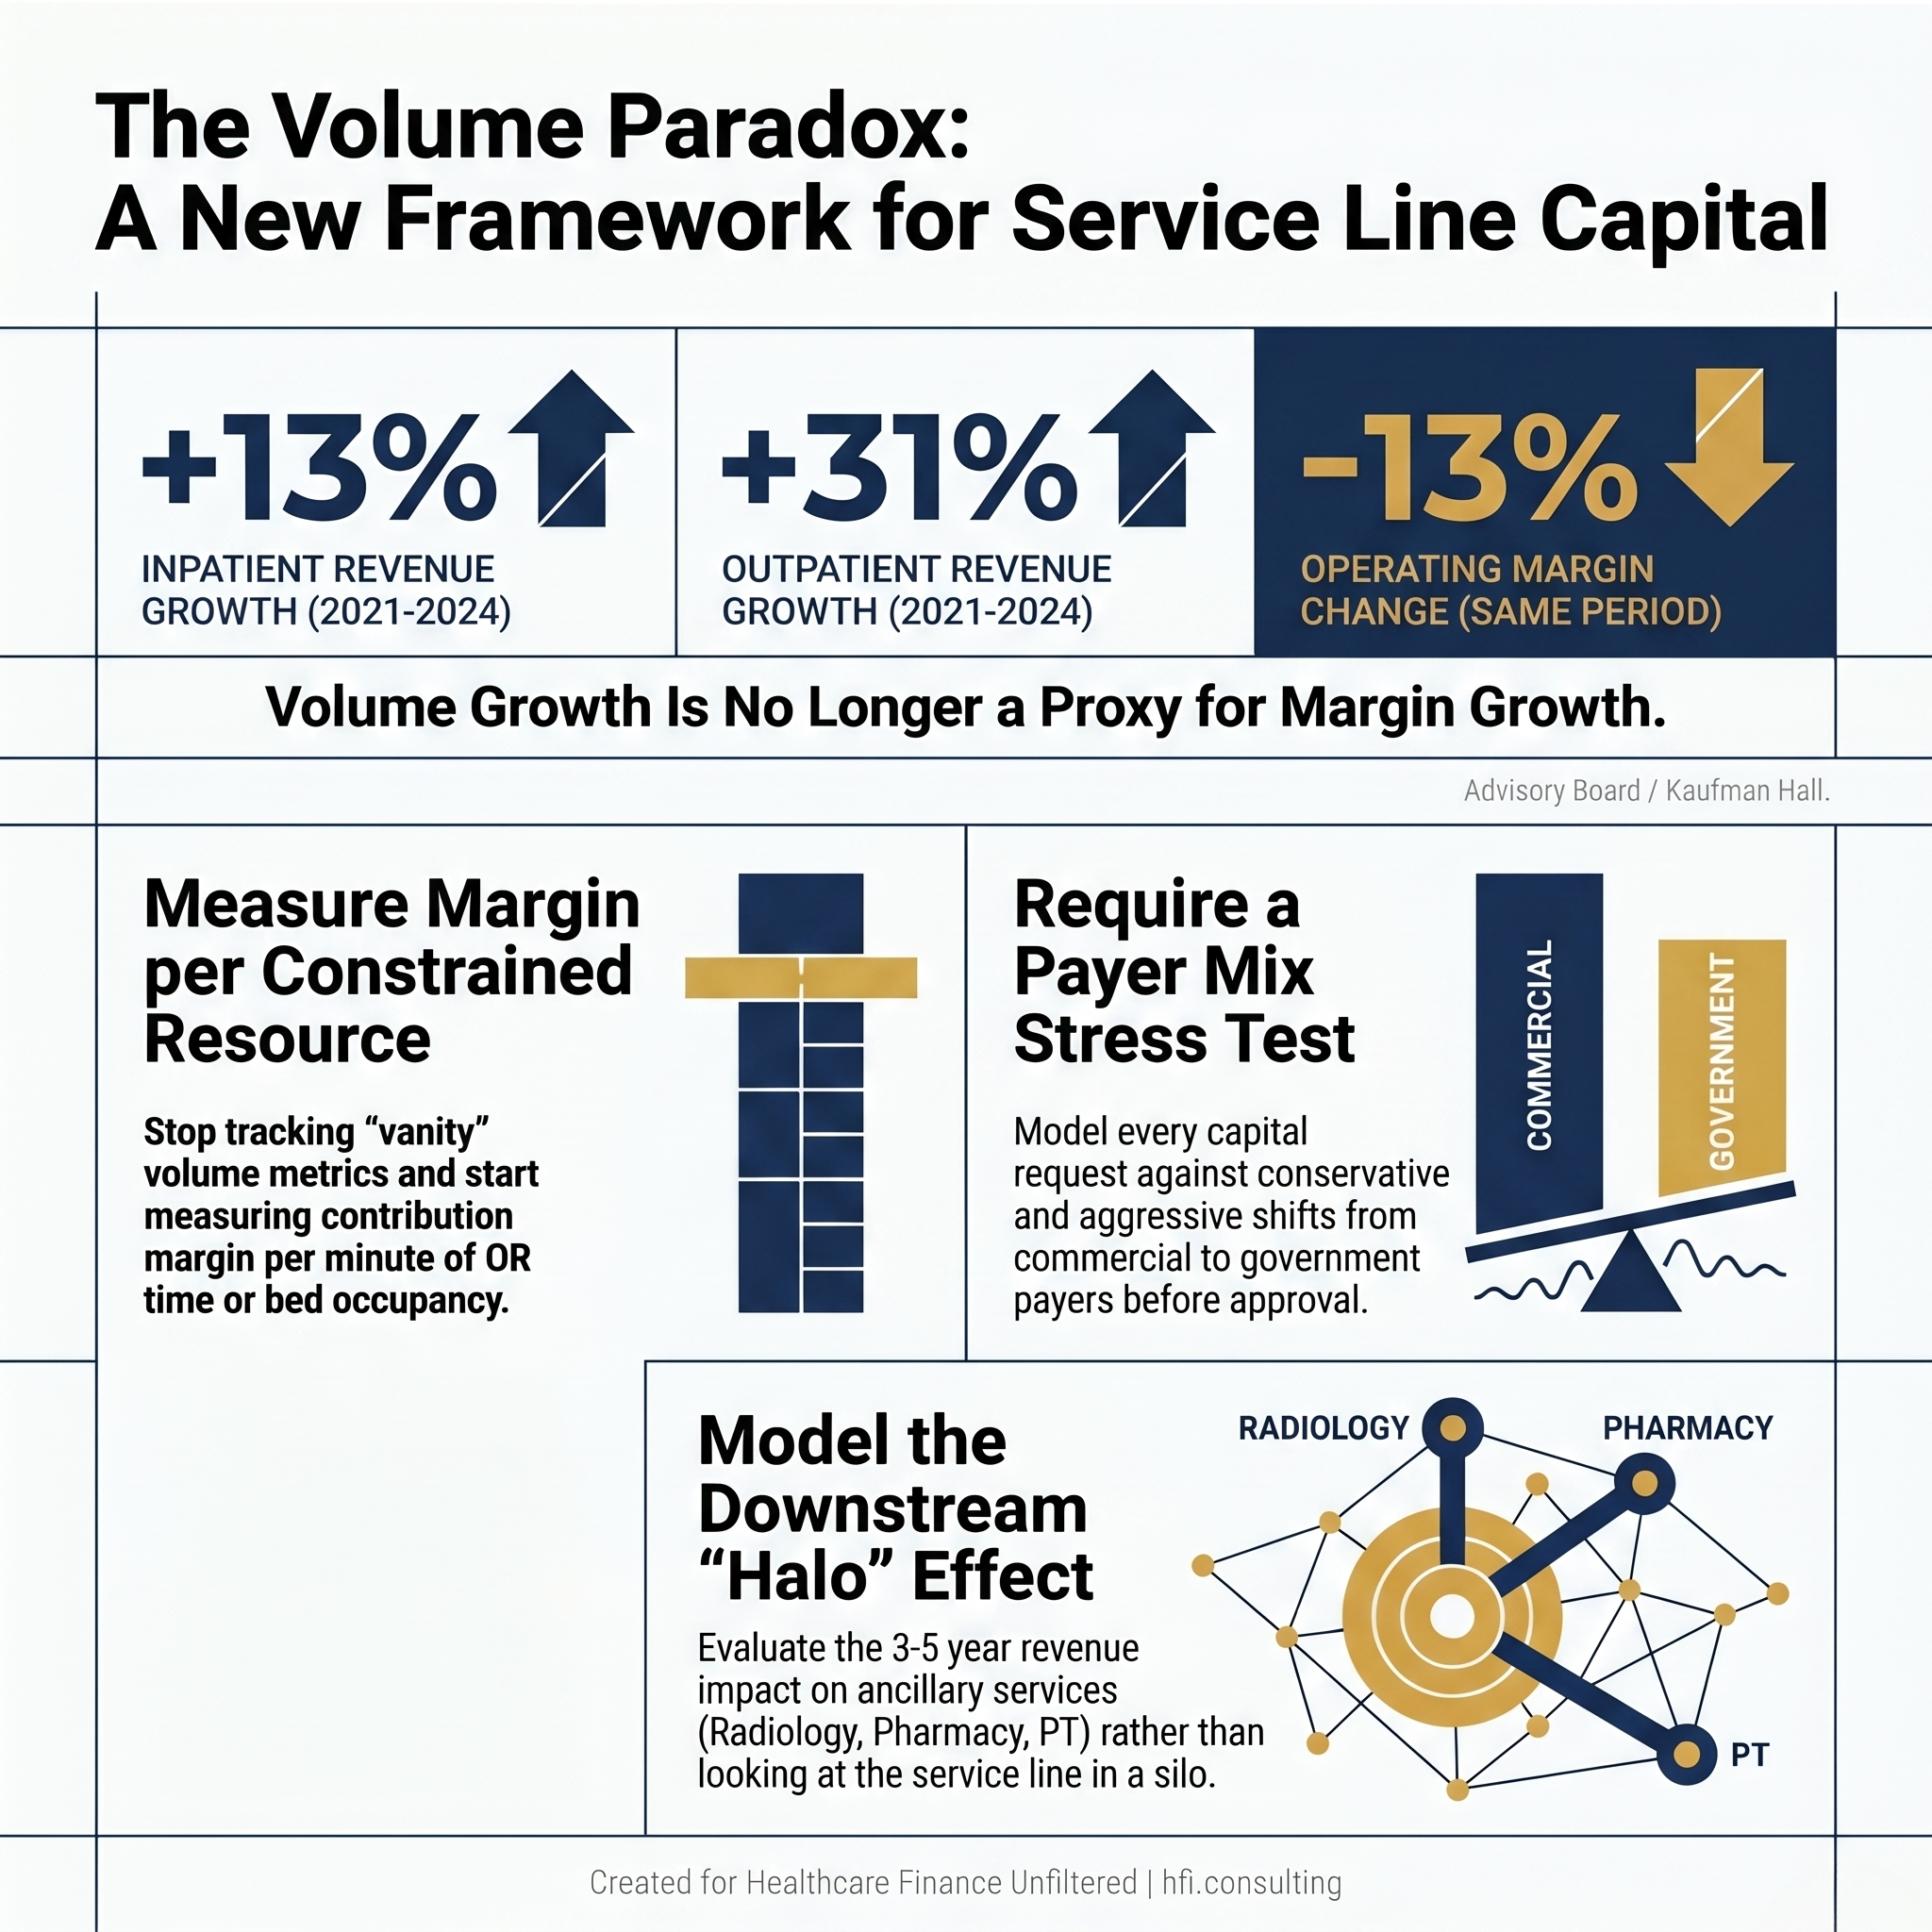
Bar chart showing 13% inpatient revenue growth, 31% outpatient revenue growth, and 13% operating margin decline from 2021 to 2024 for U.S. hospitals.
This is the pressure point most health system CFOs are navigating right now. Service lines have historically been the engine of system growth, but the conventional playbook is producing diminishing returns. Payer mix is shifting toward government payers. Low-acuity, higher-margin procedures are migrating to outpatient settings. And the patient population is getting older and sicker at younger ages, which means the case mix is becoming more complex and less profitable simultaneously.
The finance leaders who are positioned well right now are not the ones approving the biggest capital requests. They are the ones redesigning how service line requests get evaluated in the first place.
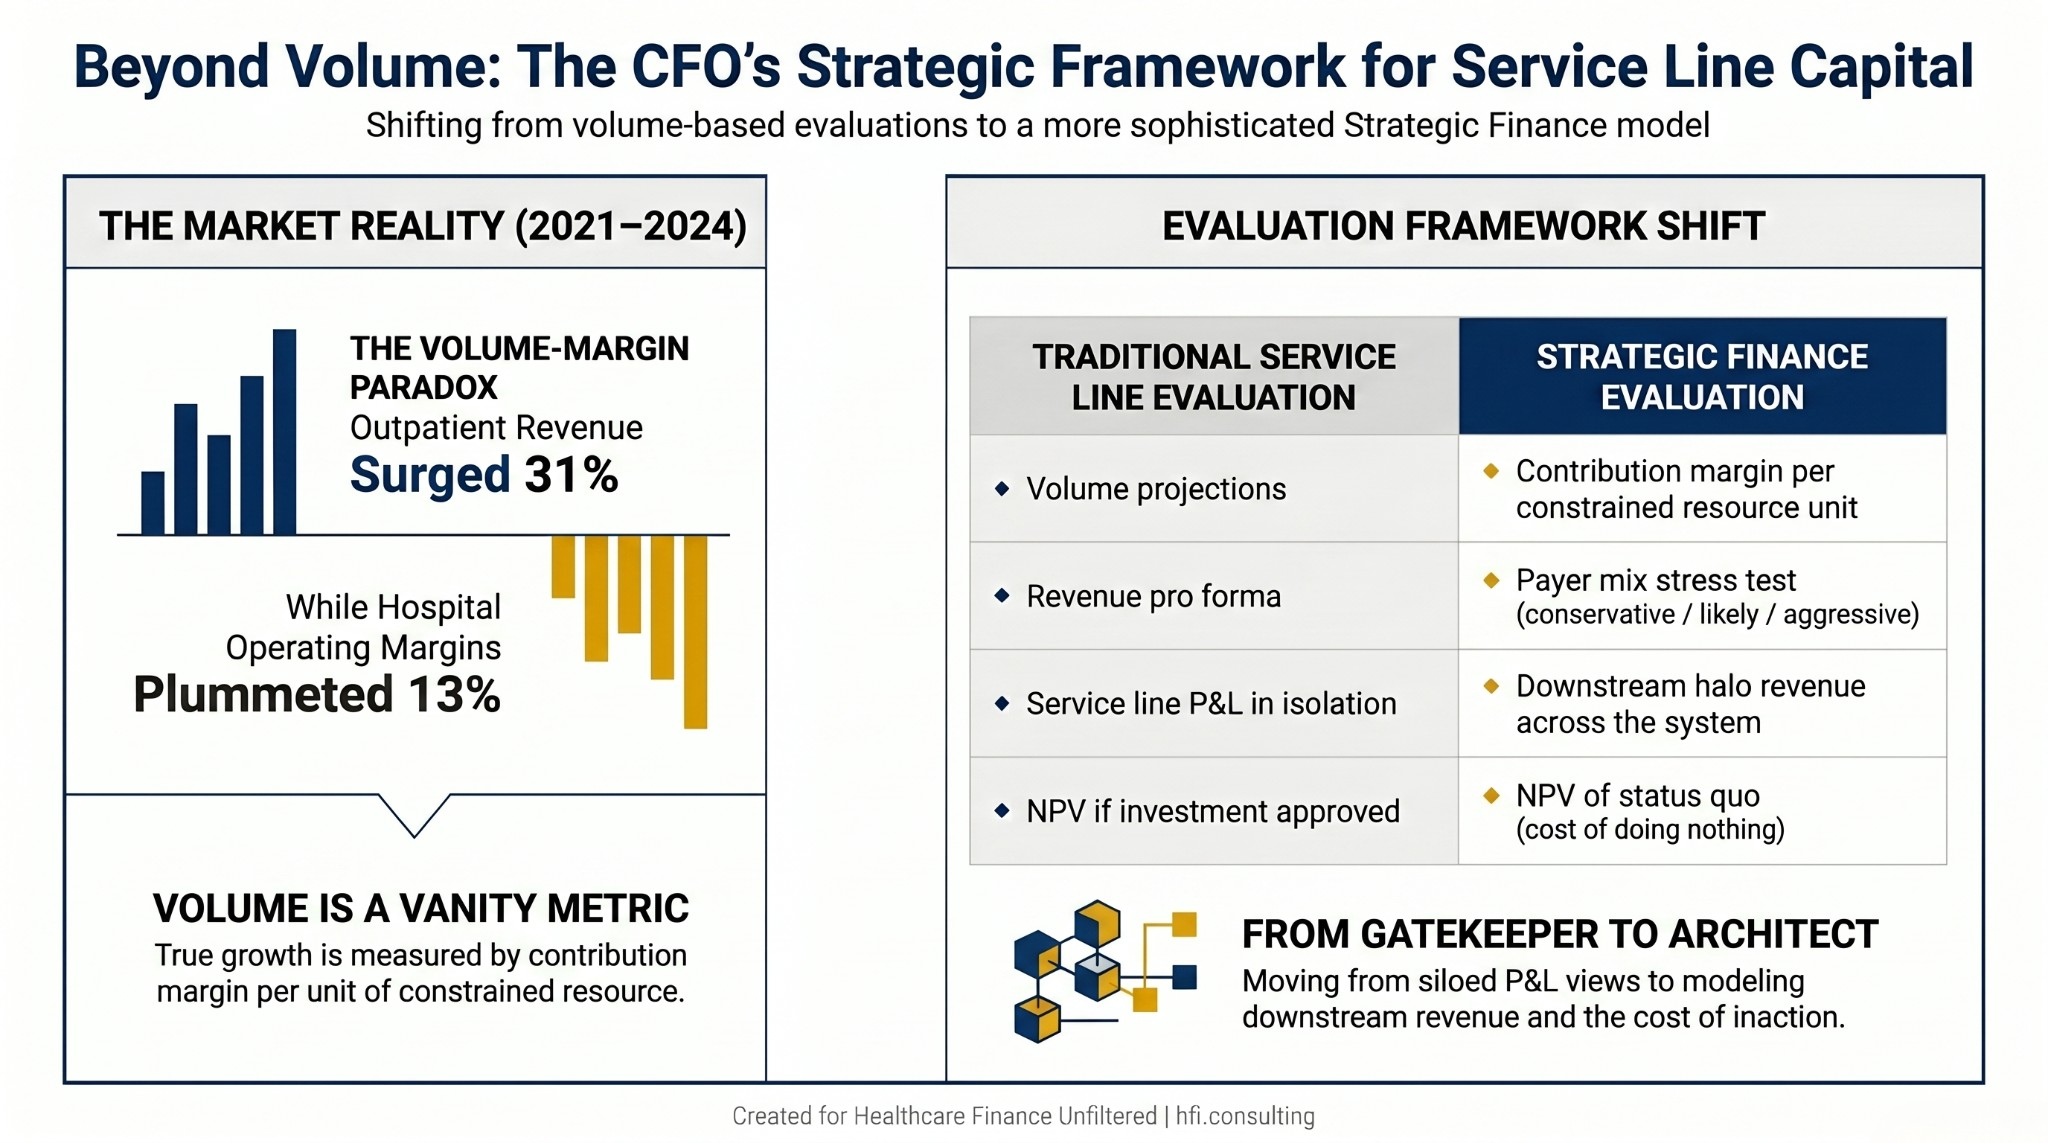
Comparison table contrasting traditional service line evaluation criteria with strategic finance evaluation criteria across four dimensions.
Start With the Right Unit of Measure
The most common mistake in service line analysis is treating volume as the primary growth signal. Total encounters are a vanity metric. In a resource-constrained environment, the question is not how many patients a service line sees. It is how much contribution margin that service line generates per unit of constrained resource.
OR time, imaging slots, and inpatient beds are all finite. When I was managing budget cycles across multi-hospital systems, the most politically charged capital conversations almost always involved a high-volume service line that looked productive on the surface but was quietly consuming capacity that could have gone to higher-margin procedures. The math only became visible when we shifted from volume-based dashboards to contribution margin per minute of OR time.
If a high-volume procedure barely covers its variable overhead but occupies four hours of OR time, that is not a strength. That is a capital allocation problem that needs to surface before the next expansion request lands on your desk.
Map Leakage Before You Build
Most service line business cases focus on acquiring new patients. The more immediate financial opportunity is capturing the patients who are already in your network but seeking specific services from a competitor.
Claims data can show clinical chairs precisely where patients are leaving the system after an initial encounter. In any mid-to-large health system, a measurable share of patients who enter through one service line are completing their episode of care at a competing institution. That is revenue and margin the system has already partially earned through the initial touchpoint.
A case for service line expansion is considerably stronger when it demonstrates patient retention alongside new capture. The math changes when you can show the board that a $3M investment in expanded access points recovers 30% of patients currently migrating out of network for downstream services. If your revenue cycle team is already tracking AI-powered revenue leakage patterns, that same claims data infrastructure can be extended to map service line out-migration.
Model the Halo, Not Just the Line
Service lines do not operate in silos financially, even when they operate in silos organizationally. A robust cardiology program generates volume for radiology, vascular surgery, and pharmacy. An investment in orthopedic surgical capacity creates downstream PT and imaging utilization. Gene and high-cost therapy programs anchor complex oncology patients across multiple service lines for extended care episodes.
When evaluating a capital request for a new specialist or a service line expansion, the P&L of that individual service line is an incomplete picture. The analysis should model downstream revenue across adjacent service lines over a three-to-five year period.
A $500,000 investment in a specialist hire might appear marginal at the service line level. It may yield $2 million or more in ancillary revenue across radiology, pharmacy, and post-acute services when you map the full care pathway. Finance leaders who present that analysis change the nature of the capital conversation entirely.
Require a Payer Mix Stress Test Before Any Pro Forma Gets Approved
A service line that looks profitable under current payer mix assumptions may not be profitable under the payer mix it will actually face in three years. This is not a speculative risk. It is a structural trend.
Government payers are growing as a share of most health system revenue. Medicare and Medicaid reimbursement rates have not kept pace with cost inflation. Commercial volumes, which have historically cross-subsidized lower-margin government payer encounters, are declining as a percentage of the mix.
Before any service line pro forma receives finance approval, it should be stress-tested under three payer mix scenarios: conservative, likely, and aggressive. If the business case only pencils out under a 60% commercial assumption, that is a high-risk capital commitment. Finance's job is to surface that risk before the board signs off, not after the facility is built.
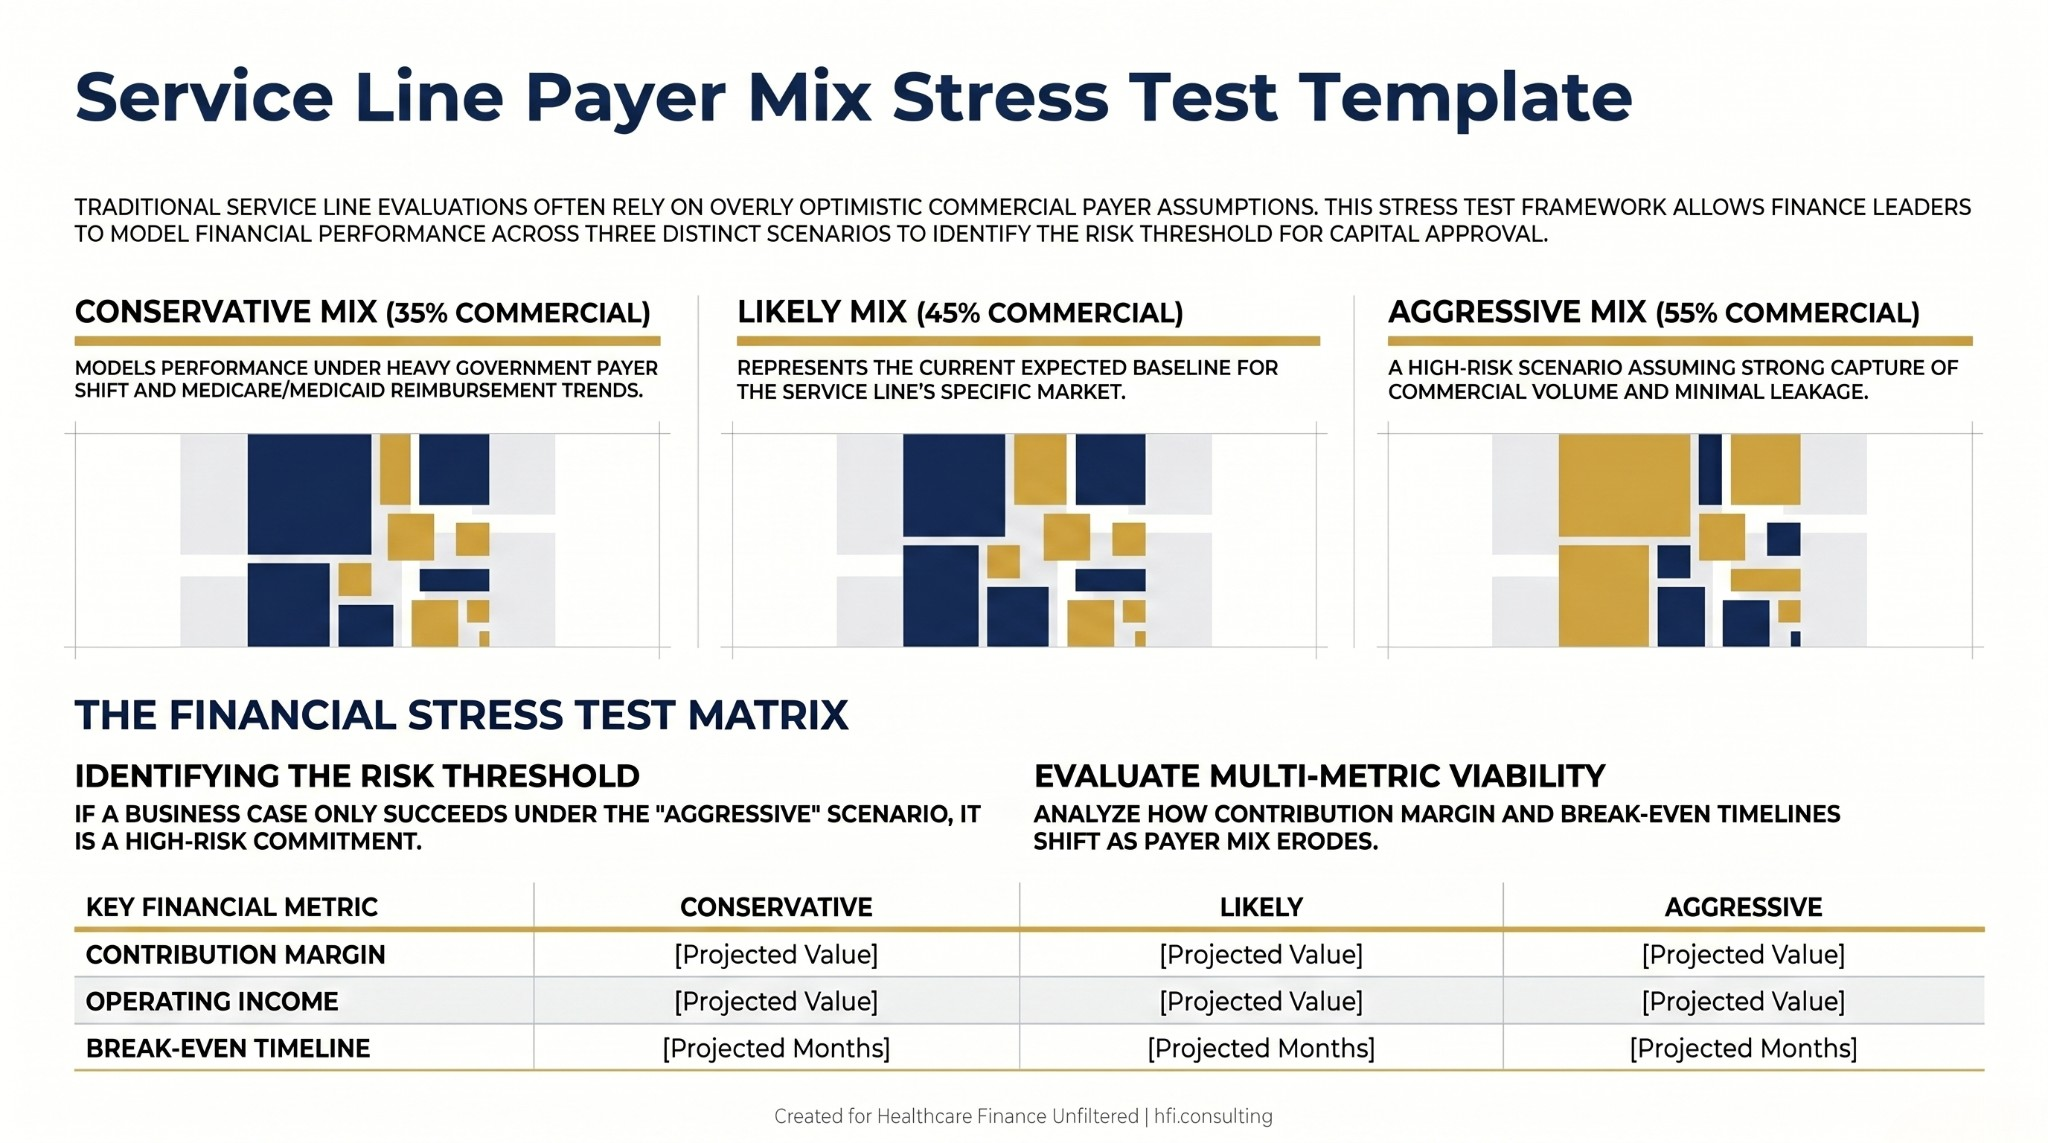
Three-column payer mix stress test template for service line financial analysis showing contribution margin and operating income projections under conservative, likely, and aggressive commercial payer mix assumptions.
Access Over Equipment
Capital committees consistently overweight equipment and underweight access. A new robotic surgical system generates significant enthusiasm from clinical leadership. Centralized scheduling infrastructure, advanced practice provider capacity, or same-day access protocols do not.
But what actually drives patient volume and retention in a competitive market is access. The metric worth tracking is the third-next-available appointment. If patients cannot get in within a clinically appropriate window, they go to whoever can see them. No equipment acquisition resolves a scheduling bottleneck.
Before approving a significant capital outlay for new technology or facility expansion, finance leadership should require evidence that access is not the binding constraint. If the third-next-available is running three to four weeks out, the equipment investment may generate volume. More often, it generates a utilization problem on top of an access problem.
Benchmarking as a Diagnostic Tool, Not a Judgment
MGMA and Vizient benchmarking data are most valuable when used to identify specific variables that are out of alignment, not when used to make global performance judgments.
A service line with labor costs per RVU in the 90th percentile warrants investigation. But the right question is whether that cost structure reflects a staffing model problem, a documentation accuracy gap, a case mix difference, or a genuine productivity opportunity. The benchmark surfaces the conversation. Finance's role is to facilitate the diagnostic, not lead with the conclusion.
When I worked through performance analytics implementations with McKesson/Change Healthcare, the most effective use of benchmarking data was in collaborative conversations with clinical leadership. The framing that produced results: "Our labor costs are significantly above peer median, but our throughput metrics are below median. Let's understand what is driving both before we build the solution." That produces different outcomes than "your labor costs are too high."
Quantify the Cost of Standing Still
One of the most underused tools in service line analysis is the NPV of the status quo. Most capital requests model the value of an investment if approved. Very few model the five-year trajectory of the service line if nothing changes.
In competitive markets, standing still is a directional choice. Market share erodes. Infrastructure ages. Physician satisfaction declines. Referral patterns shift to competitors who are investing. By the time the effects are visible on a dashboard, the recovery cost is substantially higher than the original investment would have been.
A five-year NPV model of the status quo scenario, built with realistic volume decay and market share loss assumptions, often changes the capital conversation entirely. The question stops being whether the organization can afford to invest and starts being whether it can afford not to.
Physician Compensation and Modular Capital Planning
Two structural elements of service line financial design that finance leaders have significant influence over are physician compensation models and capital phasing.
Compensation models that reward raw work RVUs are misaligned with the financial outcomes most CFOs are trying to achieve. If you need a service line to improve patient satisfaction scores, documentation accuracy, or access metrics, the compensation model needs to reward those behaviors explicitly. Finance should be actively involved in compensation model design, not just approval.
On capital, the "all or nothing" $20 million request is often a product of how organizations structure their planning cycles. Staged capital models that tie incremental investment to volume and financial performance milestones reduce organizational risk substantially. Hire the provider. Demonstrate volume. Refurbish the clinic. Buy the equipment when the trigger metrics are met. This is not a reluctance to invest. It is a governance structure that aligns investment with demonstrated demand.
If Your Evaluation Process Needs a Rebuild, That Is Exactly the Work I Do
The analytical work described here is not theoretical. It requires claims data access, payer mix modeling capability, benchmarking subscriptions, and the time to build multi-scenario pro formas. Most finance teams have some of these tools and are under-utilizing them relative to what the capital decision environment now demands.
If your current service line evaluation process consists primarily of volume projections and a single-scenario pro forma, the framework above represents a meaningful upgrade. If your organization is preparing for a major service line capital cycle and needs structured support building these models, that is the work I do directly with finance teams through hfi.consulting.
Service line capital decisions are too consequential to make with incomplete financial architecture. The investment in building the right evaluation framework pays for itself in the first avoided mistake.
Work with me at hfi.consulting
The CFO as Architect
Finance leaders in high-performing health systems have moved from a gatekeeping function to an architectural one. The distinction matters. Gatekeeping is transactional. It applies a financial threshold to a request and produces an approval or a denial. Architecture is generative. It helps service line leaders understand what conditions need to be true for a responsible yes, and it builds the analytical scaffolding to get there.
When a service line business case is weak, the most useful response is not a denial. It is a specific identification of which variable needs to change. Is it payer mix? Labor cost structure? Access metrics? Downstream capture rate? Give clinical leadership a financial roadmap, not a verdict.
That kind of partnership between finance and service line leadership is what produces durable capital decisions. It is also what positions the CFO as a strategic partner rather than a budget enforcer.
The CFO who builds this kind of evaluation infrastructure does not just protect the organization from bad capital decisions. They build the credibility to be a genuine partner in growth strategy. That is the transition worth making.
If your service line capital process needs an upgrade, I work with finance teams to build the frameworks, the models, and the analytical infrastructure that makes those conversations more productive. Start at hfi.consulting.

Decision flowchart for service line capital request pre-approval review covering payer mix stress testing, status quo NPV, halo revenue, and access constraint analysis.
P.S. I want to hear from you: what is the one service line capital evaluation step your organization consistently skips? Is it the payer mix stress test, the halo revenue model, or the status quo NPV? Hit reply and tell me. The answers tend to be more consistent across organizations than people expect.