
Contribution Margin Is Lying to You: What the Q2 Payer Mix Crisis Means for Every Level of Healthcare Provider
Revenue grew 5.9% YOY. Margins kept shrinking. Here is why the math is not adding up for CFOs at every provider tier.
The Q2 numbers are in, and they tell a story that should make every healthcare CFO stop and look harder at the line between revenue and margin.
Gross operating revenue grew 5.9% year over year in May, according to Strata Decision Technology data. Individual hospital expenses rose 5.5% in the same period. Supplies up 4%. Labor up 3.9%. Drugs up 3.3%. On paper, revenue is outpacing expenses. So why are operating margins under siege?
Because the numbers on your income statement and the numbers in your cost accounting system are not telling the same story.
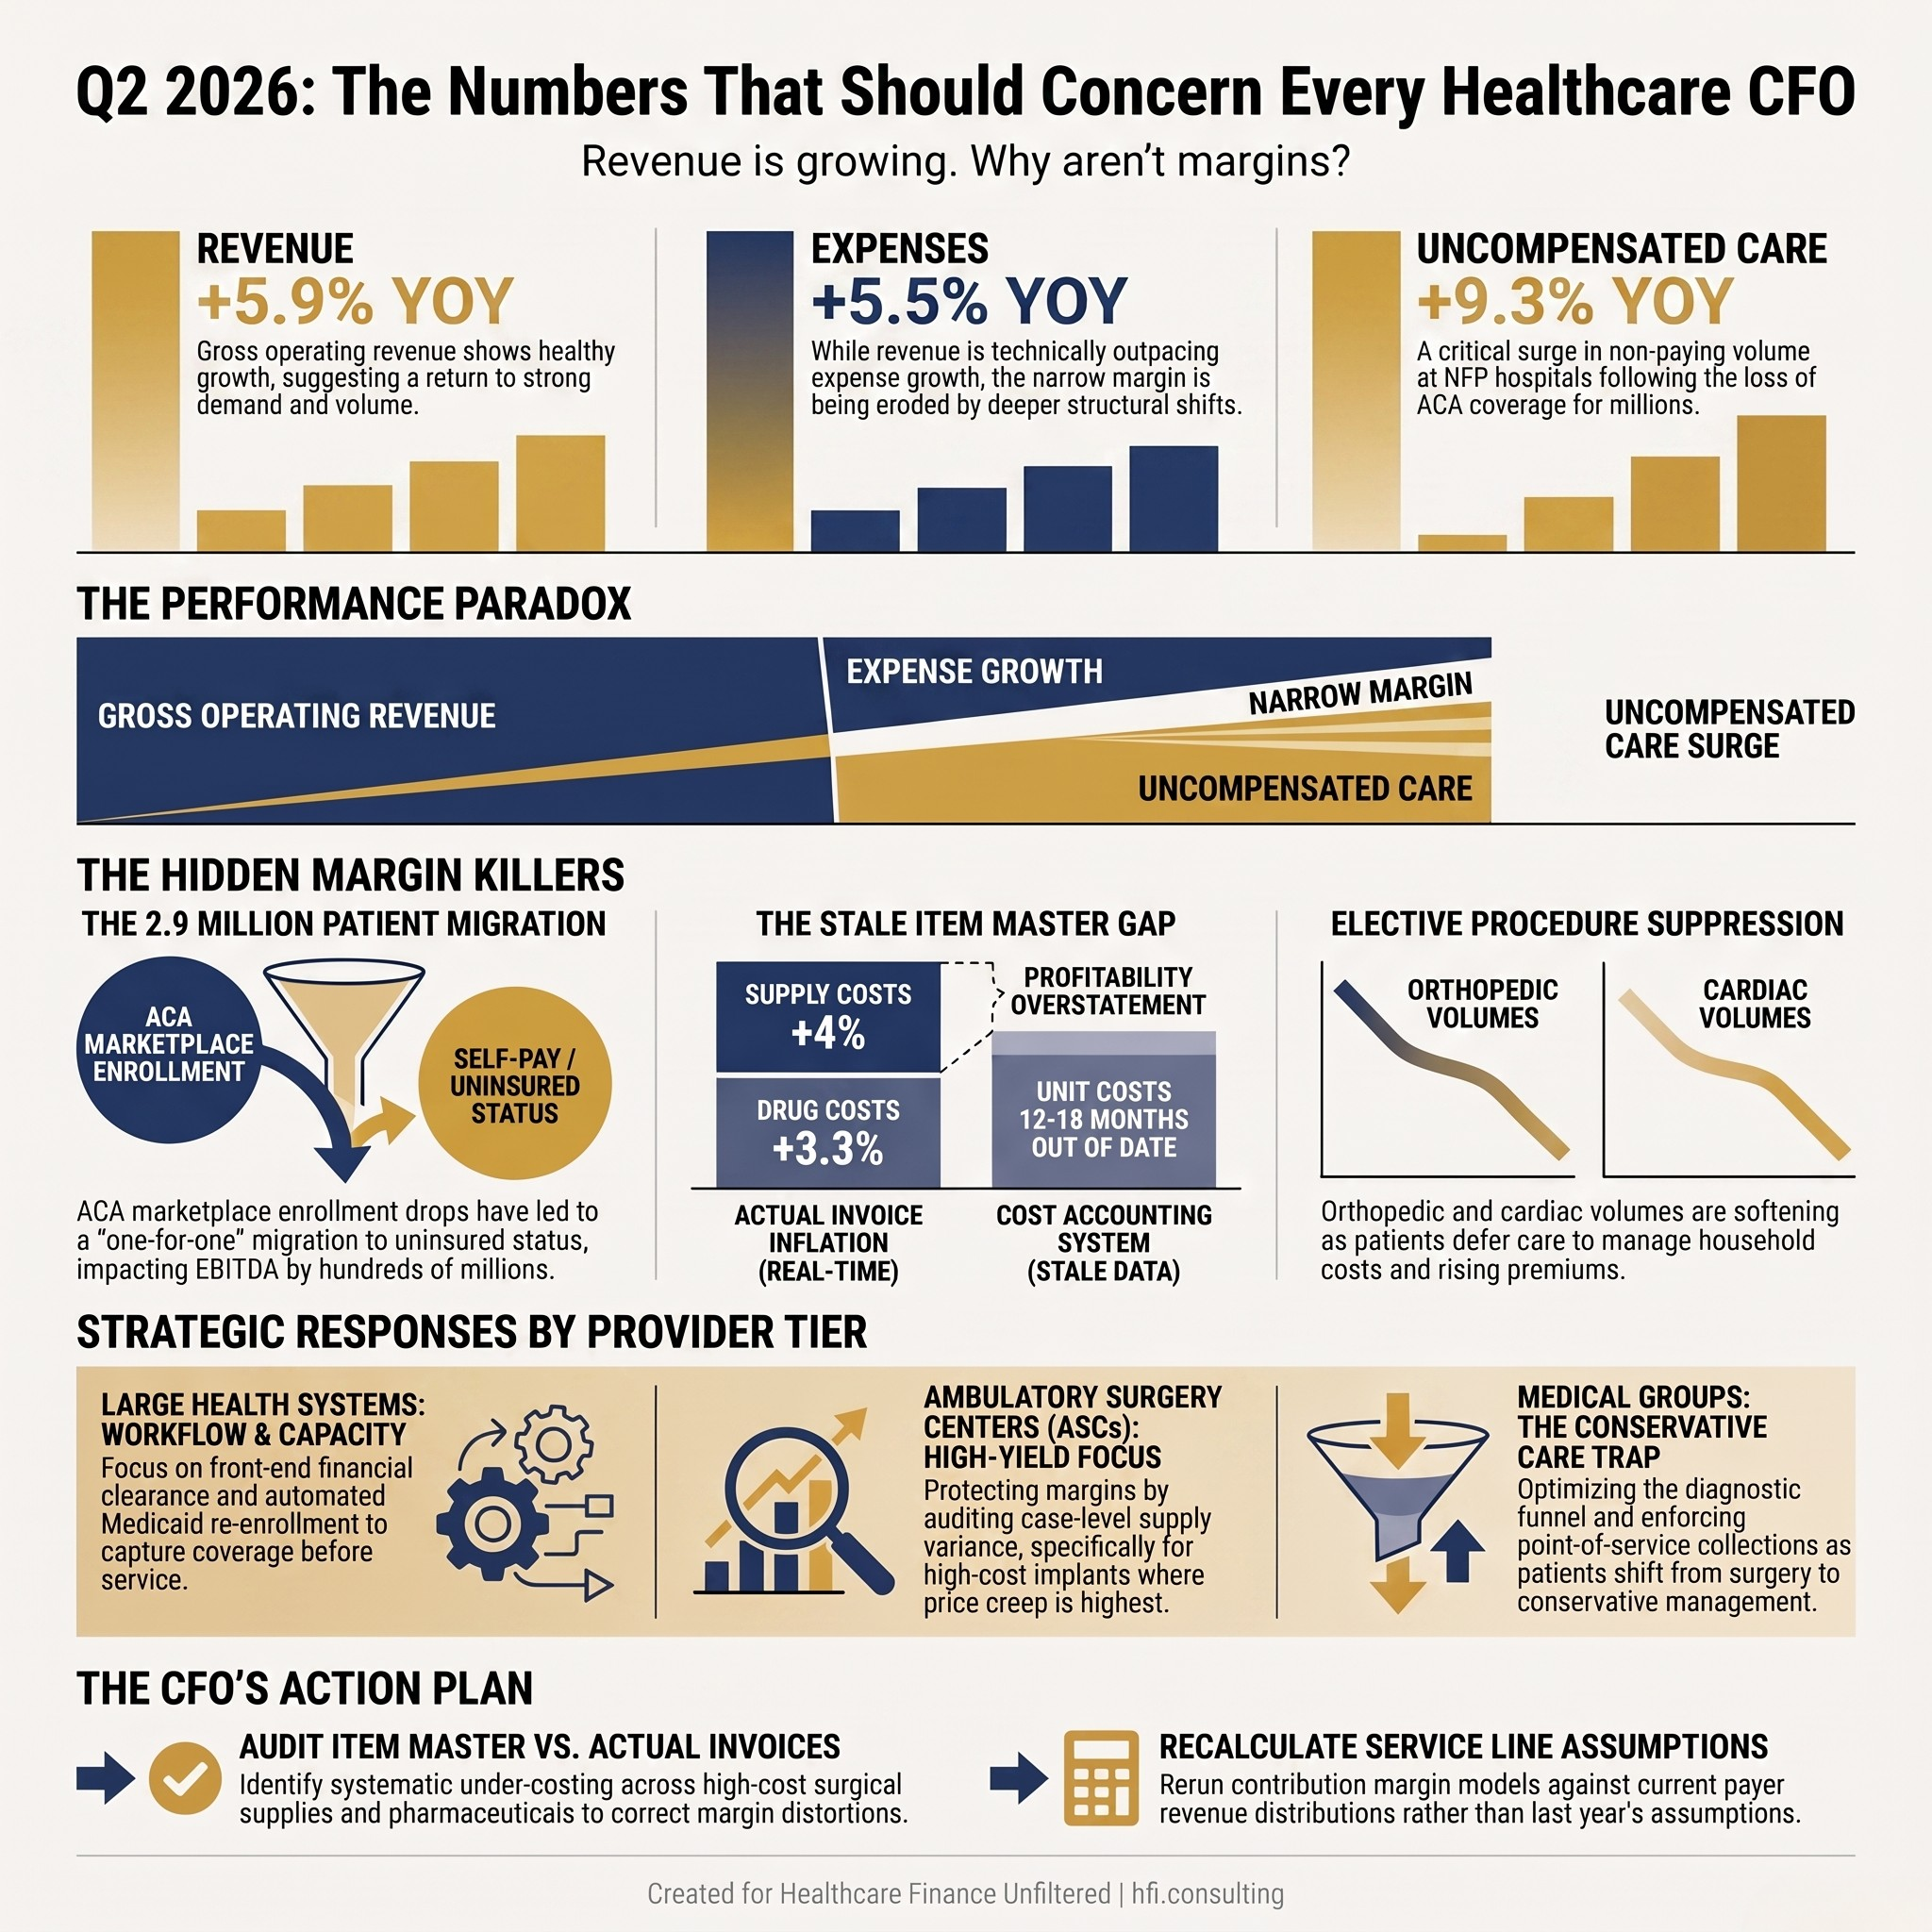
Q2 2026 healthcare finance data showing 5.9% revenue growth alongside 5.5% expense growth and 9.3% uncompensated care increase for hospital CFOs
The Payer Mix Shift Is Not a Policy Headline. It Is a Balance Sheet Event.
ACA marketplace enrollment dropped by at least 2.9 million this year. HCA Healthcare CEO Sam Hazen said it plainly in Q2 earnings: patients who lost coverage "migrated almost one for one to uninsured." That shift cost HCA an estimated $400 million in EBITDA impact in a single quarter, even as overall EBITDA grew.
Tenet Healthcare reported a 13.5% decline in marketplace admissions with associated revenue dropping roughly $65 million. Community Health Systems revised its 2026 investor guidance mid-year as self-pay activity surged. And in the not-for-profit sector, uncompensated care grew 9.3% year over year through May.
This is not a Medicaid funding story or a policy debate story. It is a volume and margin story that is already in your Q2 financials.
The payer mix shift is compounding an existing problem: elective procedure volume is declining. HCA reported overall same-facility elective surgery volume down 2.3% year over year. CHS noted declines in orthopedics and cardiac procedures. Patients who kept ACA coverage are cutting food and household spending to afford premiums, and they are deferring procedures they can delay.
Your diagnostic volumes may look stable. But if your orthopedic and cardiac surgical volumes are softening and you have not adjusted your service line contribution margin assumptions, your budget is running on stale data.
This is where I want to slow down and separate the margin problem from the revenue problem, because most CFOs I talk with are solving for the wrong one.
Why Contribution Margin Looks Better Than It Is
Revenue growth of 5.9% feels like progress. But contribution margin integrity requires that your cost accounting system reflects what you actually paid for the supplies, drugs, and implants that drove that revenue.
In complex health systems, item master unit costs frequently lag behind real-time invoice pricing on high-cost surgical supplies, implants, and pharmaceuticals. When item master costs are understated, cost accounting systems overstate contribution margins across major DRGs and service lines. What looks profitable on your service line dashboard may be actively eroding your bottom line at the case level.
I have seen this play out at health systems running the same margins the industry is reporting right now. When supply and drug costs inflate at 4% and 3.3% respectively, and your item master has not been audited against actual vendor invoices in the past 12 to 18 months, the gap compounds quietly quarter by quarter.
At Ascension, managing financial operations across seven hospitals, one of the most consistent findings in our cost accounting work was the spread between what we thought high-acuity service lines were earning and what they were actually contributing after correcting for item master cost-loading errors. The orthopedic and spine service lines were the most frequent offenders. Not because anyone was careless. Because implant pricing changes faster than most item master update cycles.
That problem does not fix itself when revenue grows. It hides better.
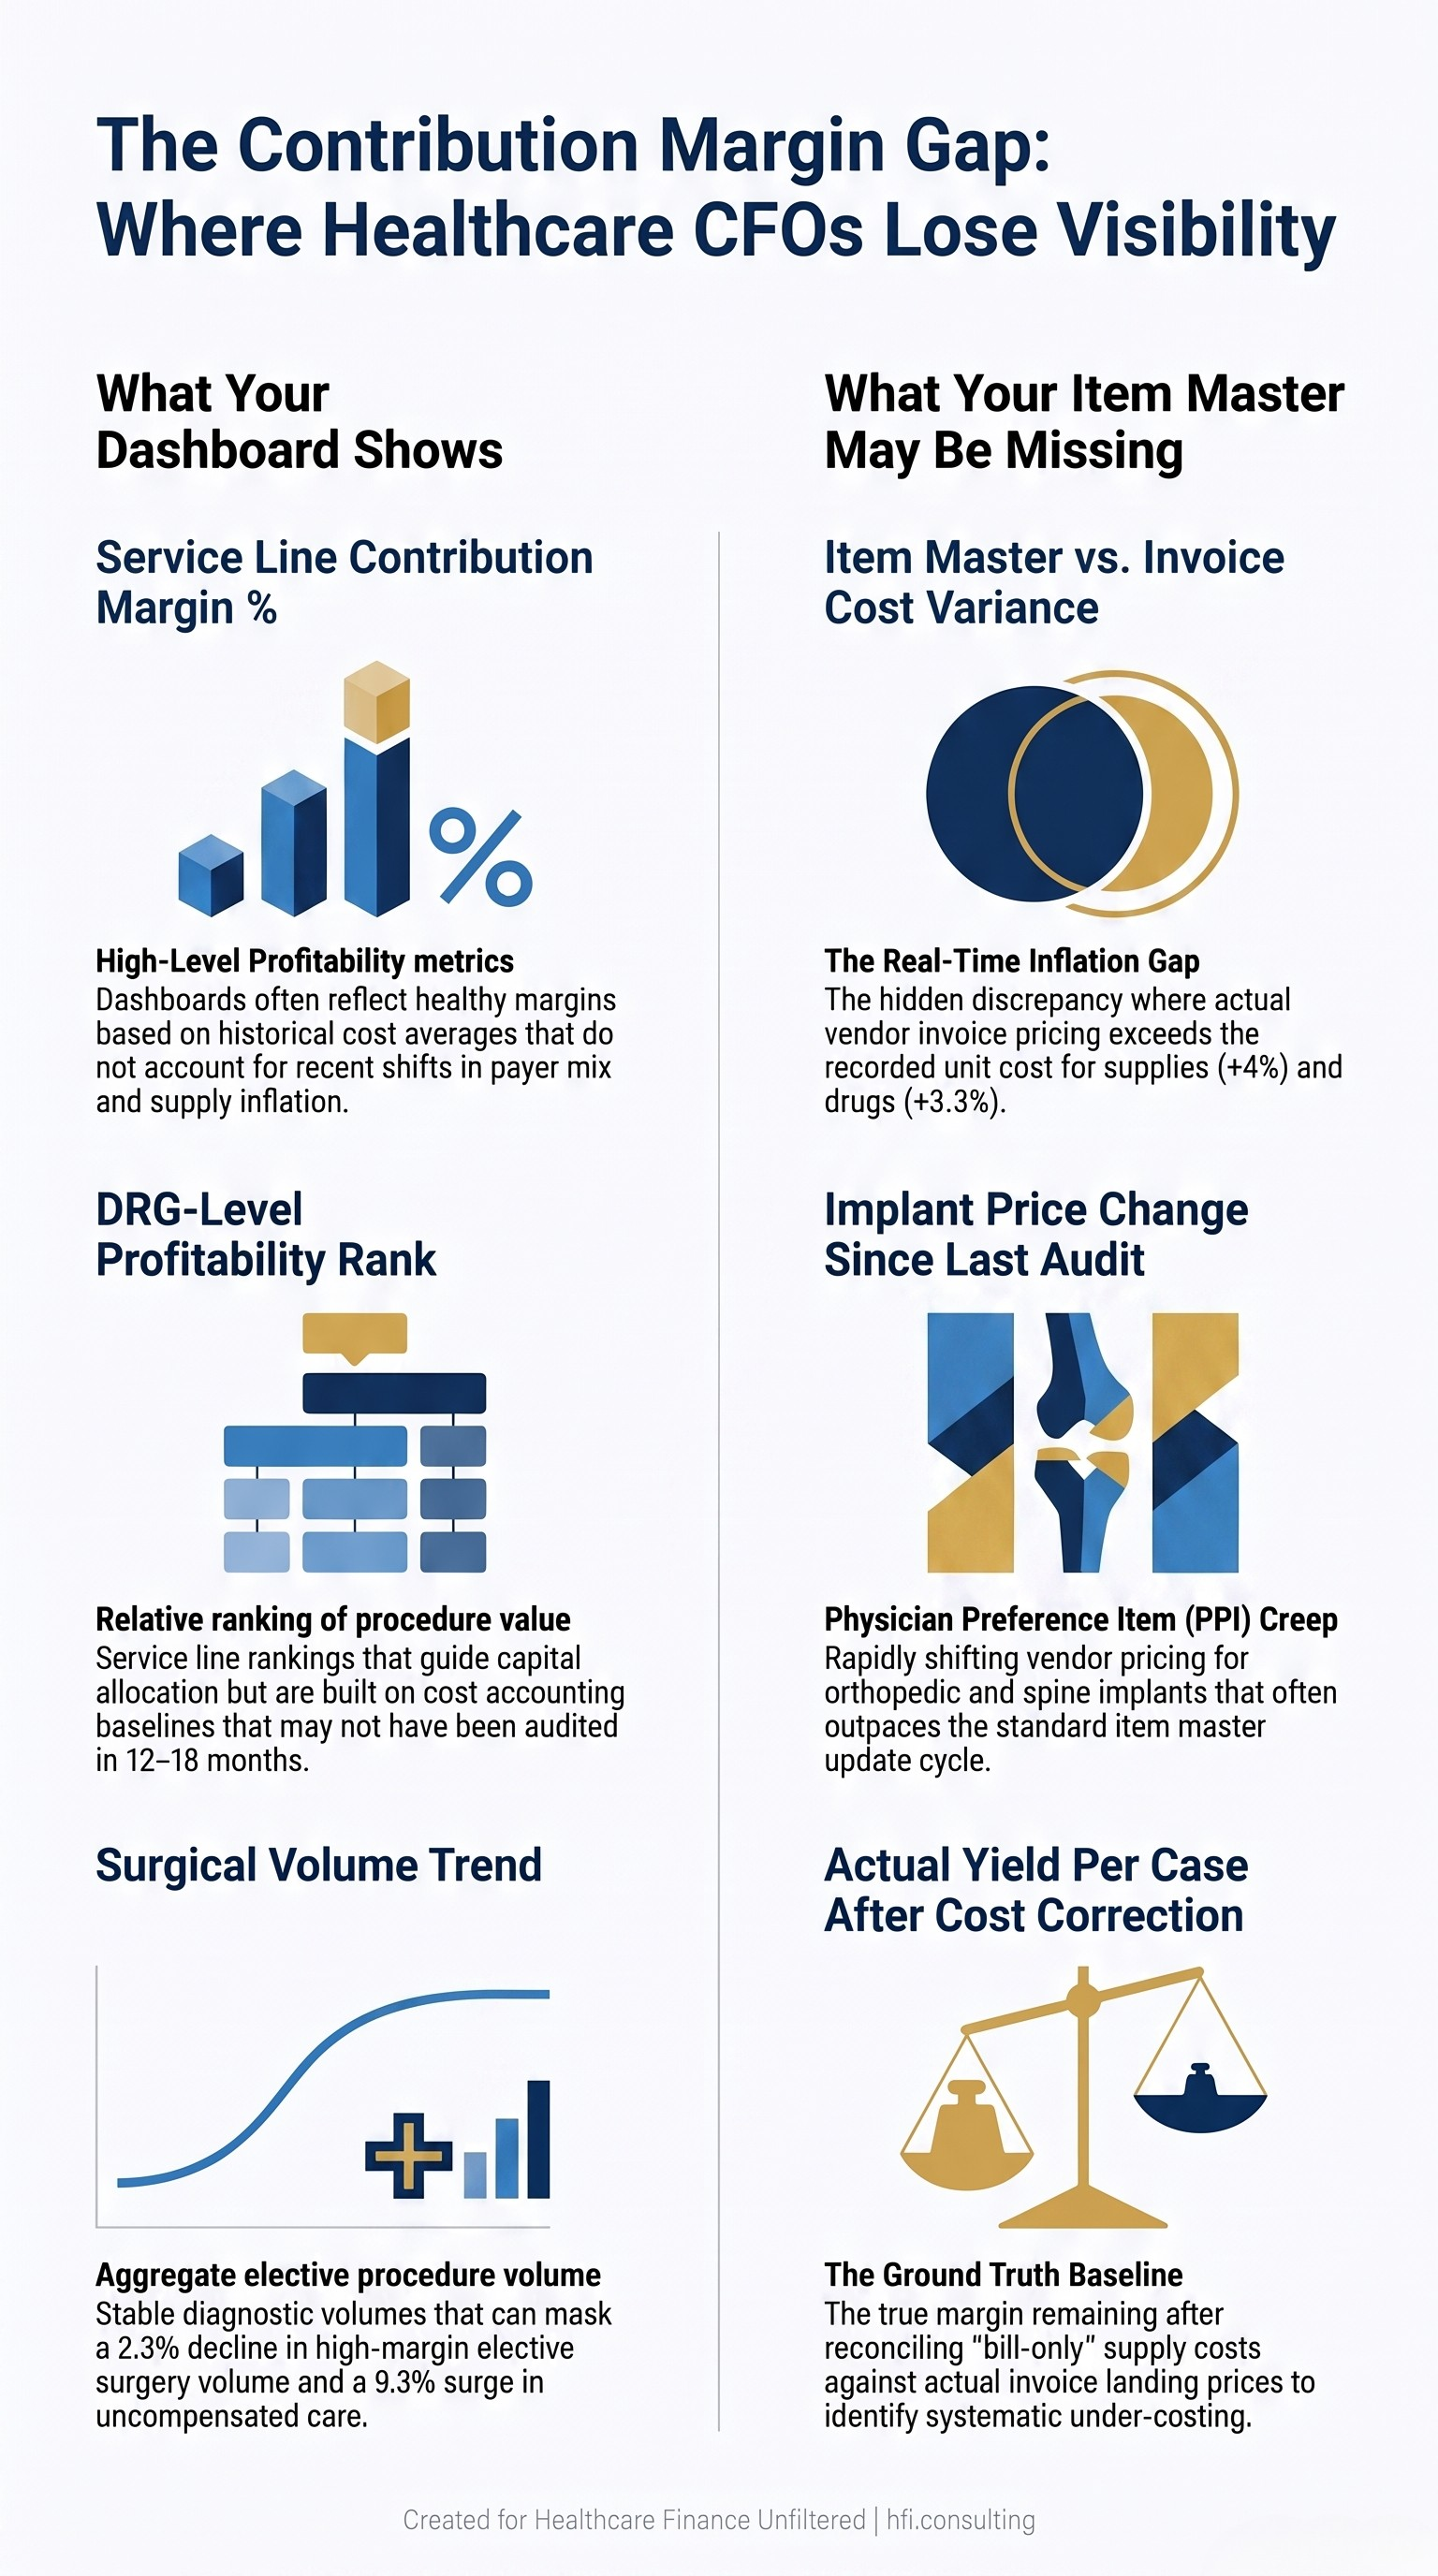
Side-by-side comparison of dashboard contribution margin metrics versus item master cost accuracy gaps for healthcare CFOs and service line finance leaders
The Three-Tier Problem Requires Three Different Responses
The Q2 data makes clear that health systems, ambulatory surgery centers, and small practices are experiencing the same macro pressures through very different operational lenses. A single playbook does not fit.
Large Health Systems
The primary threat is margin compression from self-pay surges combined with elevated input costs. Uncompensated care up 9.3% YOY at NFP hospitals is not a charity care line item problem. It is a front-end workflow problem.
Financial clearance workflows need to catch patients before service delivery, not after. Automated Medicaid and marketplace re-enrollment tools at registration, combined with presumptive eligibility screening, can capture coverage that registration teams are currently missing. The patients are not uninsured by choice. They are uninsured because the enrollment process failed them.
On the cost side, the gap between health system operating margins (0.4% YTD through May) and individual hospital margins (0.2% YTD) is worth examining closely. That disparity reflects enterprise-level administrative and operating expenses that may or may not be allocated to individual hospitals. Centralizing non-clinical administrative functions and rationalizing supply chain logistics is where large systems have the most addressable overhead.
Capital allocation in this environment should prioritize high-acuity acute care. Inpatient volumes grew 2.4% YOY in NFP hospitals, even as outpatient volumes softened. HCA is planning to add 1,000 to 1,200 inpatient beds across its nearly 200 hospitals. The underlying demand for acute care is real. The strategic question is whether your capacity mix reflects where patients are actually arriving.
Ambulatory Surgery Centers
ASC leaders are navigating a more concentrated version of the same pressure. Lower-acuity elective procedures are exactly the cases that patients are deferring. Orthopedic volume is down. Cardiac is soft. The cases that are holding are higher-acuity procedures with better margins per case.
Tenet's CFO Sun Park reported that net revenue per case jumped 6.3% even as same-facility surgical case volumes fell 1.2%, explicitly attributing that to a high-acuity focus. That is the operational posture ASC leaders need to be building toward: fewer cases, higher yield per case.
The financial risk hiding in that strategy is supply cost variance. A $500 discrepancy between item master cost and actual invoice cost on a high-cost implant can erase a surgical margin entirely. As case mix shifts toward total joints and complex spine, physician preference item costs become the single biggest uncontrolled variable on the ASC income statement.
The ASCs that will protect margin through this environment are auditing their case-level contribution margins against actual invoice landing prices, not against item master averages. That distinction is not academic. It is a quarterly P&L decision.
Small Practices and Medical Groups
The challenge here is quieter but accumulating. Patients are coming to clinic visits and MRI appointments. They are not converting to the higher-value procedures. CHS leadership described this directly: patients are getting cortisone shots and managing pain conservatively rather than proceeding to orthopedic surgery.
That means clinic visits, diagnostic imaging, and chronic disease management are carrying the revenue line for practices whose business models were built around surgical volume. If your revenue cycle infrastructure was not designed to optimize the diagnostic and conservative care funnel, you are leaving collections on the table at exactly the moment you can least afford it.
Collection protocols at the point of check-in need to enforce copay, deductible, and past-due balance collection before service delivery. Card-on-file agreements for post-adjudication balances are standard in high-performing practices and still uncommon in the broader market.
For practices carrying thin physician distribution margins, the supply and drug cost problem is real even at smaller scale. In-office injectables, biologics, and diagnostic supplies are all subject to the same invoice price creep that inflates item master cost errors in larger systems. The absolute dollars are smaller. The margin impact as a percentage of a practice's total profitability can be significant.
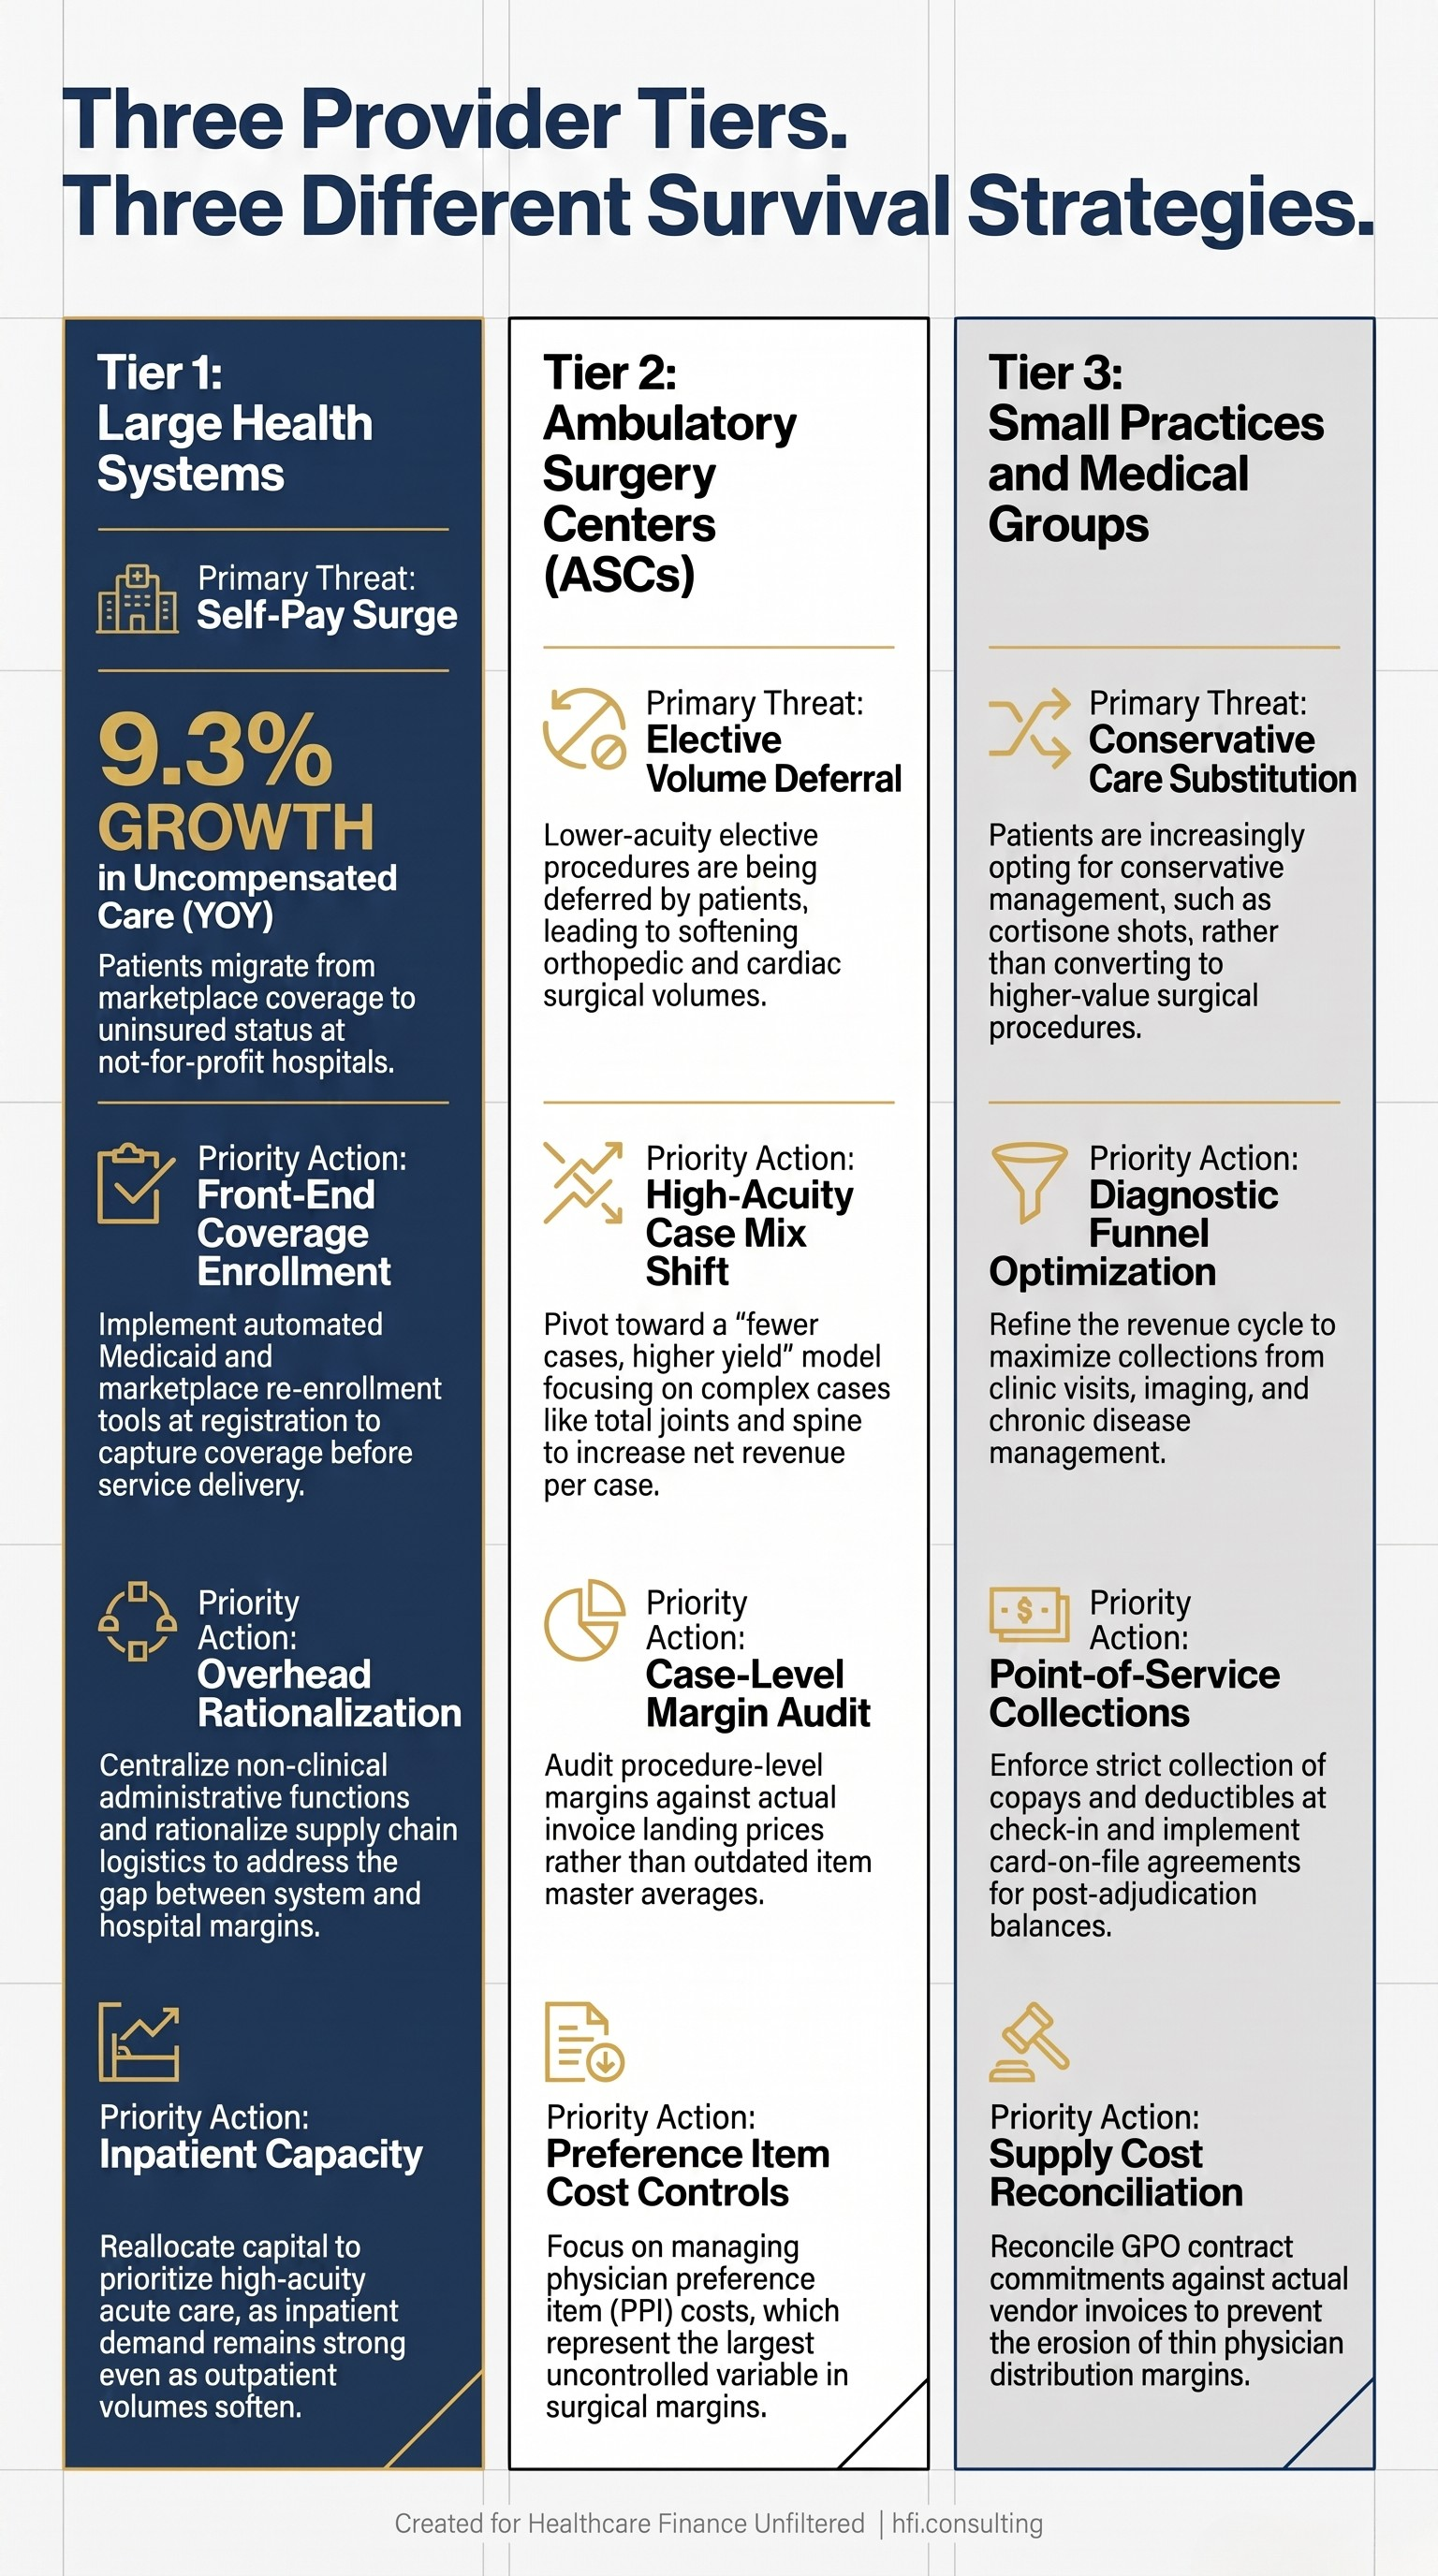
Three-tier healthcare provider financial strategy framework showing different margin protection priorities for health systems, ambulatory surgery centers, and medical practices
What the Data Is Actually Telling CFOs Across All Three Tiers
The HFMA Q2 data and the Strata Decision Technology reports point to a structural pattern, not a cyclical blip.
Revenue is growing. Expenses are growing slightly faster. Payer mix is deteriorating. Volume in elective categories is softening. And the cost accounting systems that feed your service line dashboards are running on item master data that has not kept pace with actual invoice pricing.
This is the environment where CFOs need ground truth on contribution margins, not the blended averages that roll up from an outdated cost accounting baseline.
The contribution margin integrity problem is not a billing problem. It is not a denial management problem. It is a foundational cost data problem that distorts every downstream decision: service line investment, payer contract modeling, strategic pricing, and capital allocation. I wrote about this in detail earlier this year in Contribution Margin Integrity: The CFO Framework for Catching What Your Dashboard Is Missing and Implant Costs Are a Contribution Margin Problem, Not a Billing Problem.
The Q2 environment adds urgency to that work. When margins are thin and payer mix is shifting, CFOs cannot afford to make capital allocation decisions based on contribution margins that overstate profitability by 200 to 400 basis points.
Where HFI Consulting Fits In This Picture
Healthcare Finance Innovations works at the intersection of GPO contracting and revenue cycle management, which is where contribution margin integrity either holds or breaks down.
For large health systems, the work starts with an item master cost-loading audit. We audit actual vendor invoices against item master unit costs to identify and correct systematic under-costing across high-cost surgical supplies, implants, and pharmaceuticals. When item master costs are corrected, chargemaster markups adjust accordingly, and under percent-of-charges commercial contracts, that correction shifts net revenue upward. Most traditional chargemaster audits do not catch this because they start at the charge level, not the cost level.
For ASCs, the focus is case-level contribution margin integrity. We audit procedure-level bill-only and preference-card supply costs against true invoice landing prices, with particular attention to orthopedic and spine implant costs where physician preference item pricing creates the largest cost variance exposure. The result is a reliable margin baseline for commercial payer negotiations and physician scheduling decisions.
For medical practices, we bring CFO-level advisory capacity without the overhead. We audit and realign cost structures for in-office diagnostics, imaging, and injectables, and we reconcile GPO contract commitments against what vendor invoices are actually charging. That gap between what your GPO promised and what you paid is where physician distribution margins quietly erode.
If you are managing the Q2 environment with contribution margin data you are not confident in, that is the conversation worth having. Learn more at hfi.consulting.
Three Scenario Planning Frameworks for the Second Half of 2026
Given where the data sits at mid-year, here are the three planning frameworks that should be on every CFO's agenda before Q3 closes.
Scenario 1: Self-Pay Volume Continues to Rise
Model a 10% to 15% increase in self-pay encounters through year-end. What does that do to your uncompensated care provision? What does it do to your DSH qualification status? Are your front-end coverage enrollment workflows capable of recapturing some percentage of those patients to Medicaid or remaining marketplace options?
For health systems with safety-net designation, the DSH payment implications are worth quantifying now rather than in the annual cost report cycle. I covered the DSH landscape in detail in DSH Lawsuit 2026: Should Your Hospital Join 131 Plaintiffs or Stay on the Sidelines?
Scenario 2: Elective Volume Remains Suppressed Through Q4
If orthopedic and cardiac elective volumes do not recover by Q4, which service lines need adjusted volume assumptions in your budget? Which capital investments predicated on elective case growth need to be revisited? What is the break-even volume threshold for service lines that are currently running below plan?
This scenario is not pessimistic. It is the scenario that HCA, CHS, and Tenet all flagged as their operational reality in Q2. Finance leaders who model it now have options. Those who wait for Q4 actuals are managing after the fact.
Scenario 3: Drug and Supply Cost Inflation Persists
The 4% supply and 3.3% drug cost increases in May represent a moderation from post-pandemic peaks. But they are still running above the revenue growth rate on a net margin basis. If those rates hold or accelerate, the service lines most exposed are the ones with high implant and pharmaceutical content and the widest gap between item master cost and actual invoice pricing.
The item master audit is the most actionable lever here. It is also the one most CFOs have not pulled recently.
What Acute Care Demand Actually Signals for Finance Leaders
One piece of the Q2 data that is easy to misread deserves direct attention.
Underlying demand for acute care is strong. HCA and Tenet both reported adjusted admission growth in the mid-2% range from Q2 2025. HCA is expanding inpatient capacity. Population growth, aging demographics, and higher rates of chronic disease are sustaining volumes even as payer mix deteriorates.
This is not a demand story. It is a payer mix story. And payer mix problems have cost accounting consequences that are different from volume problems.
When your volume is stable but your payer mix is shifting toward self-pay and uncompensated care, every service line's contribution margin calculation needs to be rerun against the new payer revenue assumptions. The contribution margin you calculated last year for an orthopedic DRG assumed a payer mix distribution that no longer exists.
That recalculation requires accurate cost data at the case level. Which brings us back to the same foundational question: when did you last audit your item master costs against actual vendor invoices?
The CFOs who come out of this environment with accurate answers to that question will make better capital decisions, negotiate stronger commercial contracts, and build forecasts that hold up through the rest of 2026. Those who rely on contribution margin data that has not been validated will be managing surprises.
For a broader look at how health system financial structures are diverging under these pressures, the analysis in The Hospital Financial Trifurcation: What Fitch, Kaufman Hall, and the AHA Data Are Actually Telling CFOs provides the strategic context for where your organization sits in the current landscape.
P.S.
What is the single cost accounting assumption in your current budget that you are least confident in right now? Hit reply and tell me. These are the questions I am tracking for follow-up content, and I read every response.
Rachel Barksdale, MHA, CHFP, is the founder of HFI Consulting and author of Healthcare Finance Unfiltered. She brings experience spanning multi-hospital finance operations, safety-net hospital cost accounting, Medicare Advantage payer operations, and healthcare analytics implementation.
