
The Hospital Three-Tier Divide: What Fitch, Kaufman Hall, and the AHA Data Are Actually Telling CFOs
Strong balance sheets and recovering margins tell part of the story. The other part is a widening performance gap that should be in every CFO's scenario model right now.
H.R. 1 hasn't even fully landed yet, and the financial gap between well-capitalized health systems and everyone else is already the largest it has ever been. If your system sits anywhere outside the top tier, the window for proactive positioning is closing faster than the timeline suggests.
Three major data sources dropped within months of each other. Fitch Ratings maintained a neutral 2026 outlook for U.S. not-for-profit hospitals. Kaufman Hall reported a 2.7% median operating margin as of October. The AHA's Costs of Caring report documented $43 billion in annual insurer-related administrative spend. Individually, each is a data point. Together, they describe a structural divide that will define the next three to five years of health system finance.
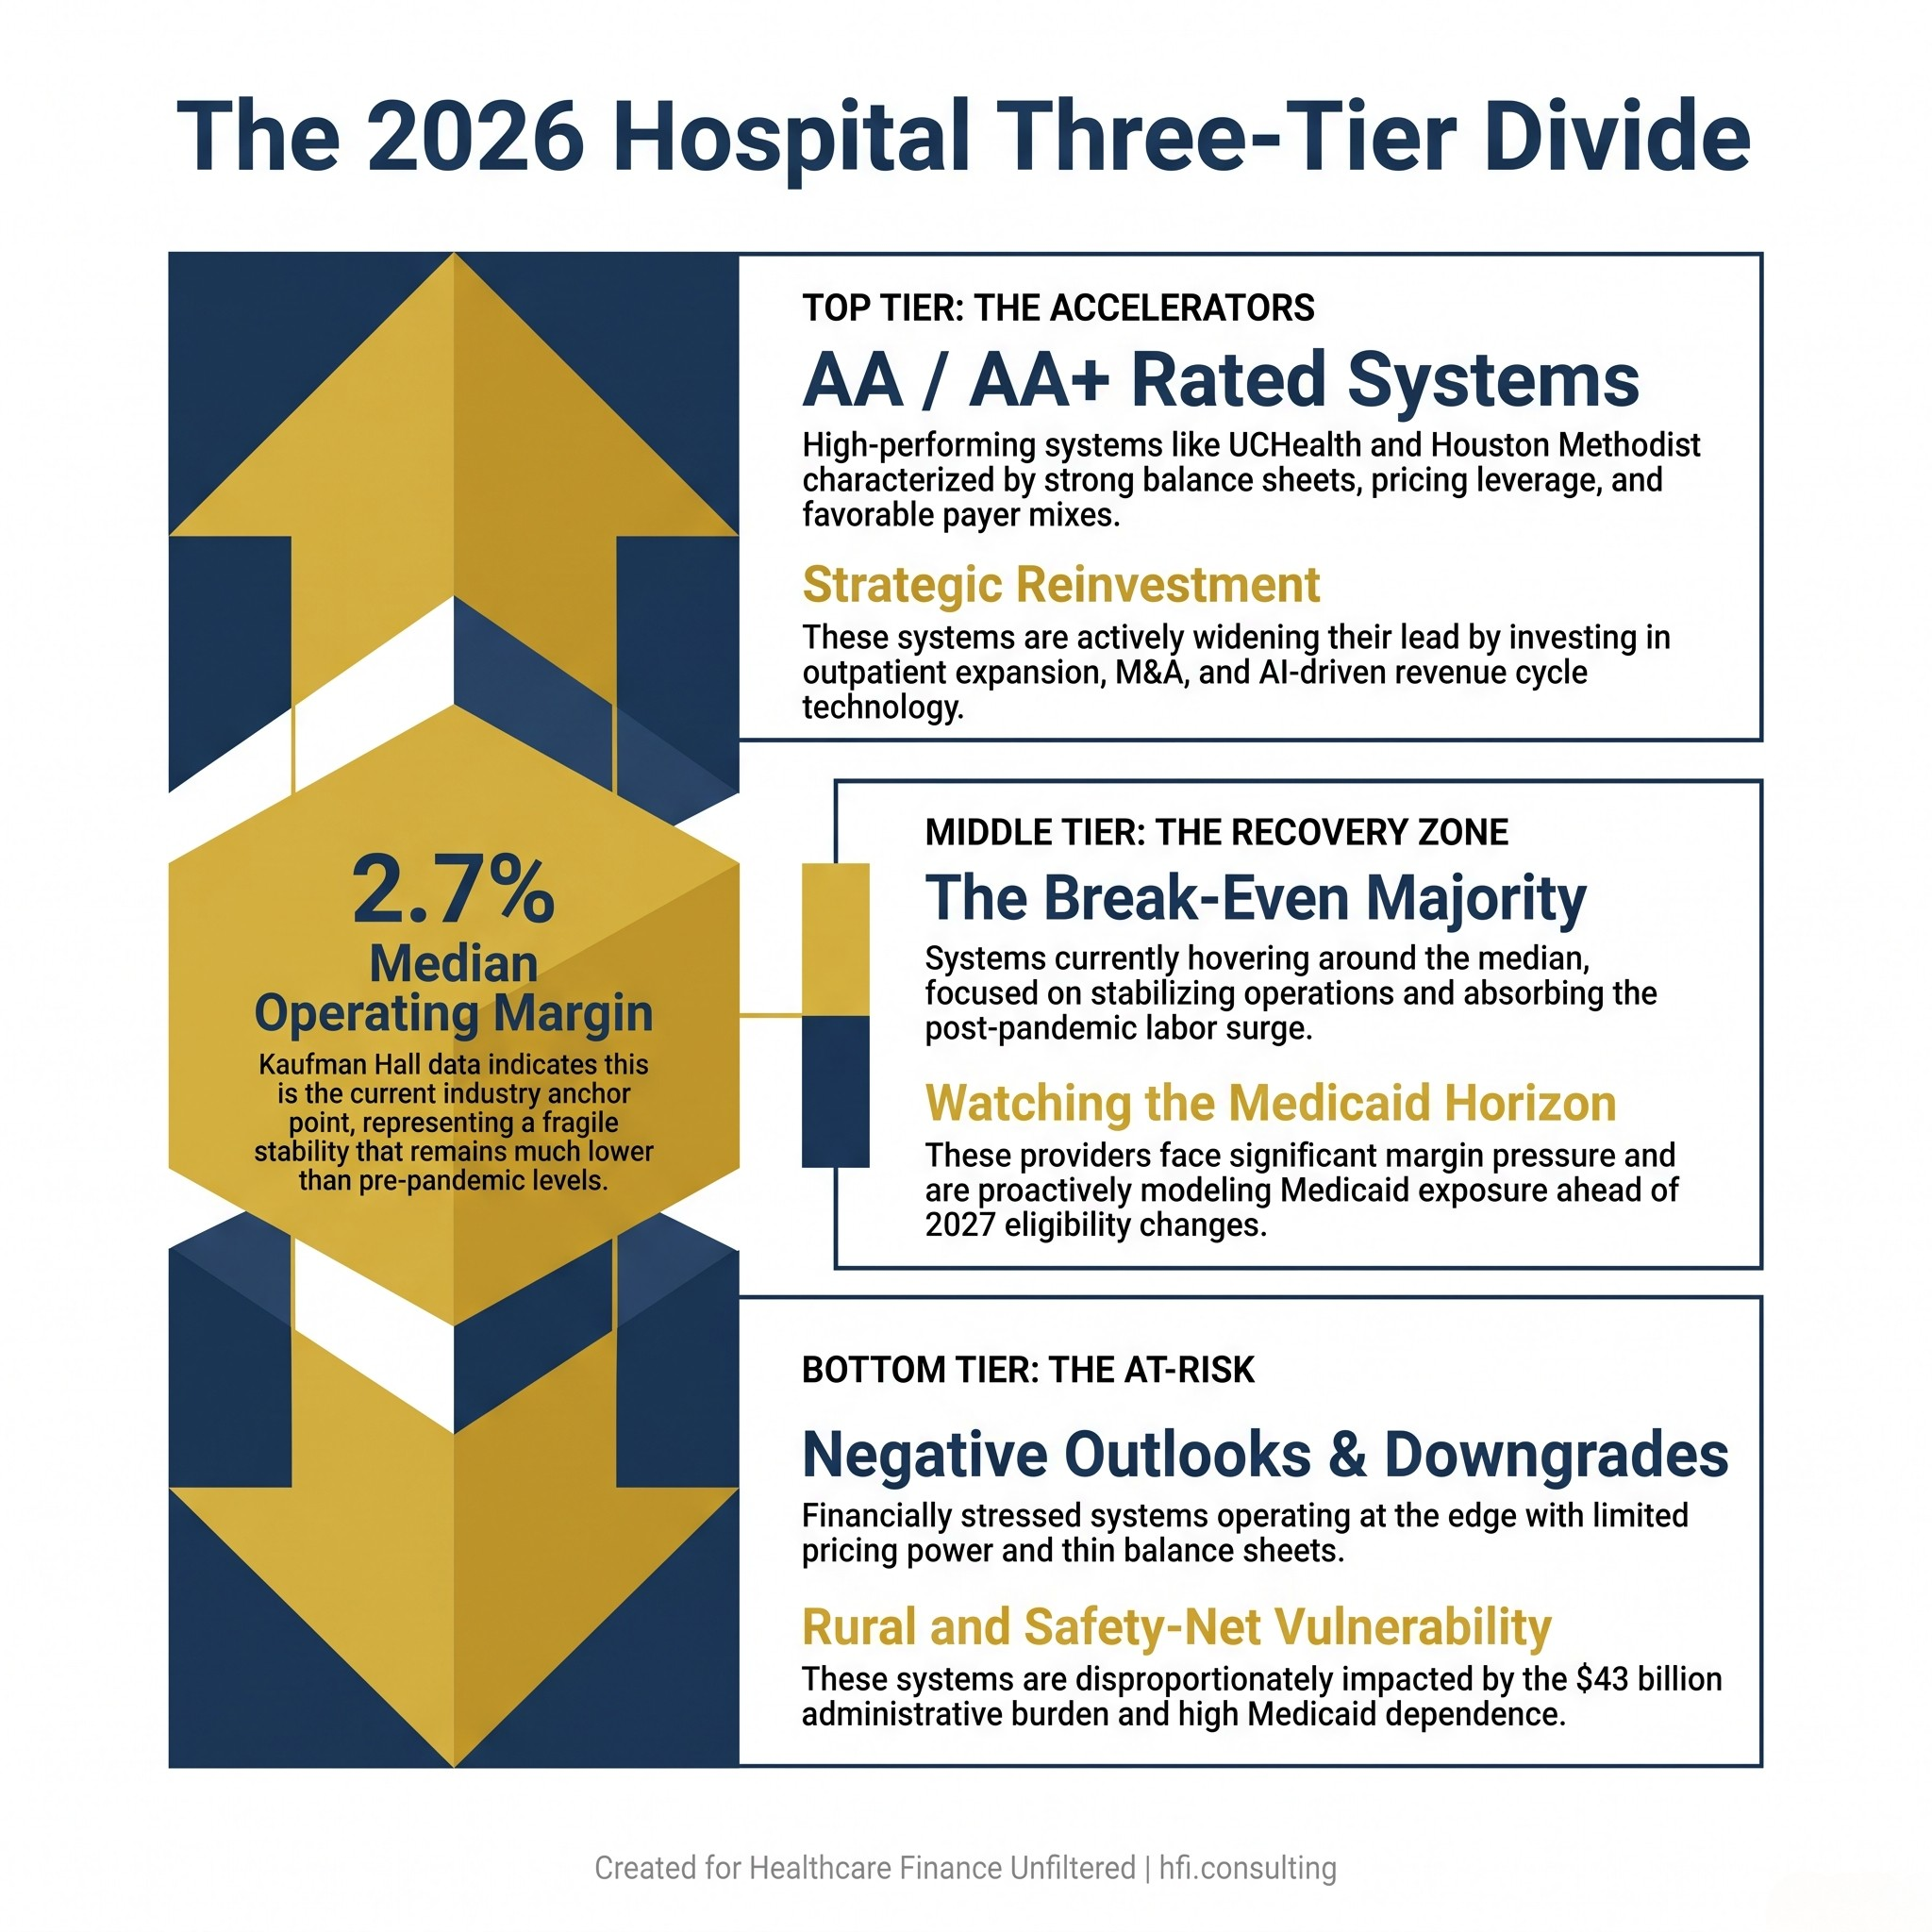
Three-tier infographic showing the financial divide among U.S. not-for-profit hospitals in 2026, from strong AA-rated systems to financially distressed providers.
What Fitch Actually Said (And What Finance Leaders Should Read Between the Lines)
Fitch's neutral outlook sounds unremarkable. It is not.
Neutral means the rating agency expects continued improvement at the sector level while simultaneously flagging what it calls "credit trifurcation" — a three-tier performance divide — as an ongoing structural reality. The systems earning the highest ratings, names like UCHealth (AA+), Houston Methodist (AA), and Kaiser Permanente (AA-), share a common profile: strong balance sheets, favorable payer mix, disciplined capital deployment, and market positions that generate pricing leverage. They are accelerating while others are still recovering.
The systems earning downgrades or negative outlooks share a different profile. They tend to serve higher Medicaid populations, operate in markets with limited pricing power, and carry less balance sheet flexibility heading into what Fitch calls the post-2026 H.R. 1 environment. Fitch noted explicitly that management teams are intensifying cost control and revenue growth to build cash reserves before Medicaid reductions begin. That language matters. Systems that are still absorbing operational losses from 2022 and 2023 do not have the same runway.
This connects directly to work I've done with multi-hospital systems managing mixed-payer portfolios. The facilities that weathered the post-pandemic labor surge best were the ones that had already systematized their productivity benchmarking before the crisis hit. The ones still catching up are now trying to tighten costs while simultaneously modeling Medicaid exposure. That is a compounding problem, not a sequential one.
For a deeper look at how restructuring decisions intersect with this kind of margin pressure, see Healthcare Bankruptcy 2026: The CFO's Restructuring Playbook Before the 2027 Margin Cliff.
The Supply Cost Problem That Is Moving Faster Than Labor
Kaufman Hall's Erik Swanson put it directly: supply costs are rising faster than labor costs, and the driver is not just price. It is utilization. As the population ages and patients arrive with more chronic conditions, the volume and complexity of specialty pharmaceuticals, implants, and durable medical equipment is increasing alongside the unit cost.
The AHA's Costs of Caring report quantifies this at the macro level. Total hospital expenses grew 7.5% in 2025. Supply costs rose 9.9%. Drug costs rose 13.6%. Workforce spending, still the largest expense category at roughly 60% of total costs, grew 5.6%.
The math matters for CFOs who are still treating supply chain as a procurement problem rather than a financial planning problem. If your drug and supply escalation assumptions in your five-year model are still pegged to a 3% to 4% annual increase, your projections are understating cost pressure by a meaningful margin. The utilization component is what separates the current supply cost environment from prior inflationary cycles. You are not just paying more per unit. You are using more units per patient, per stay, per encounter.
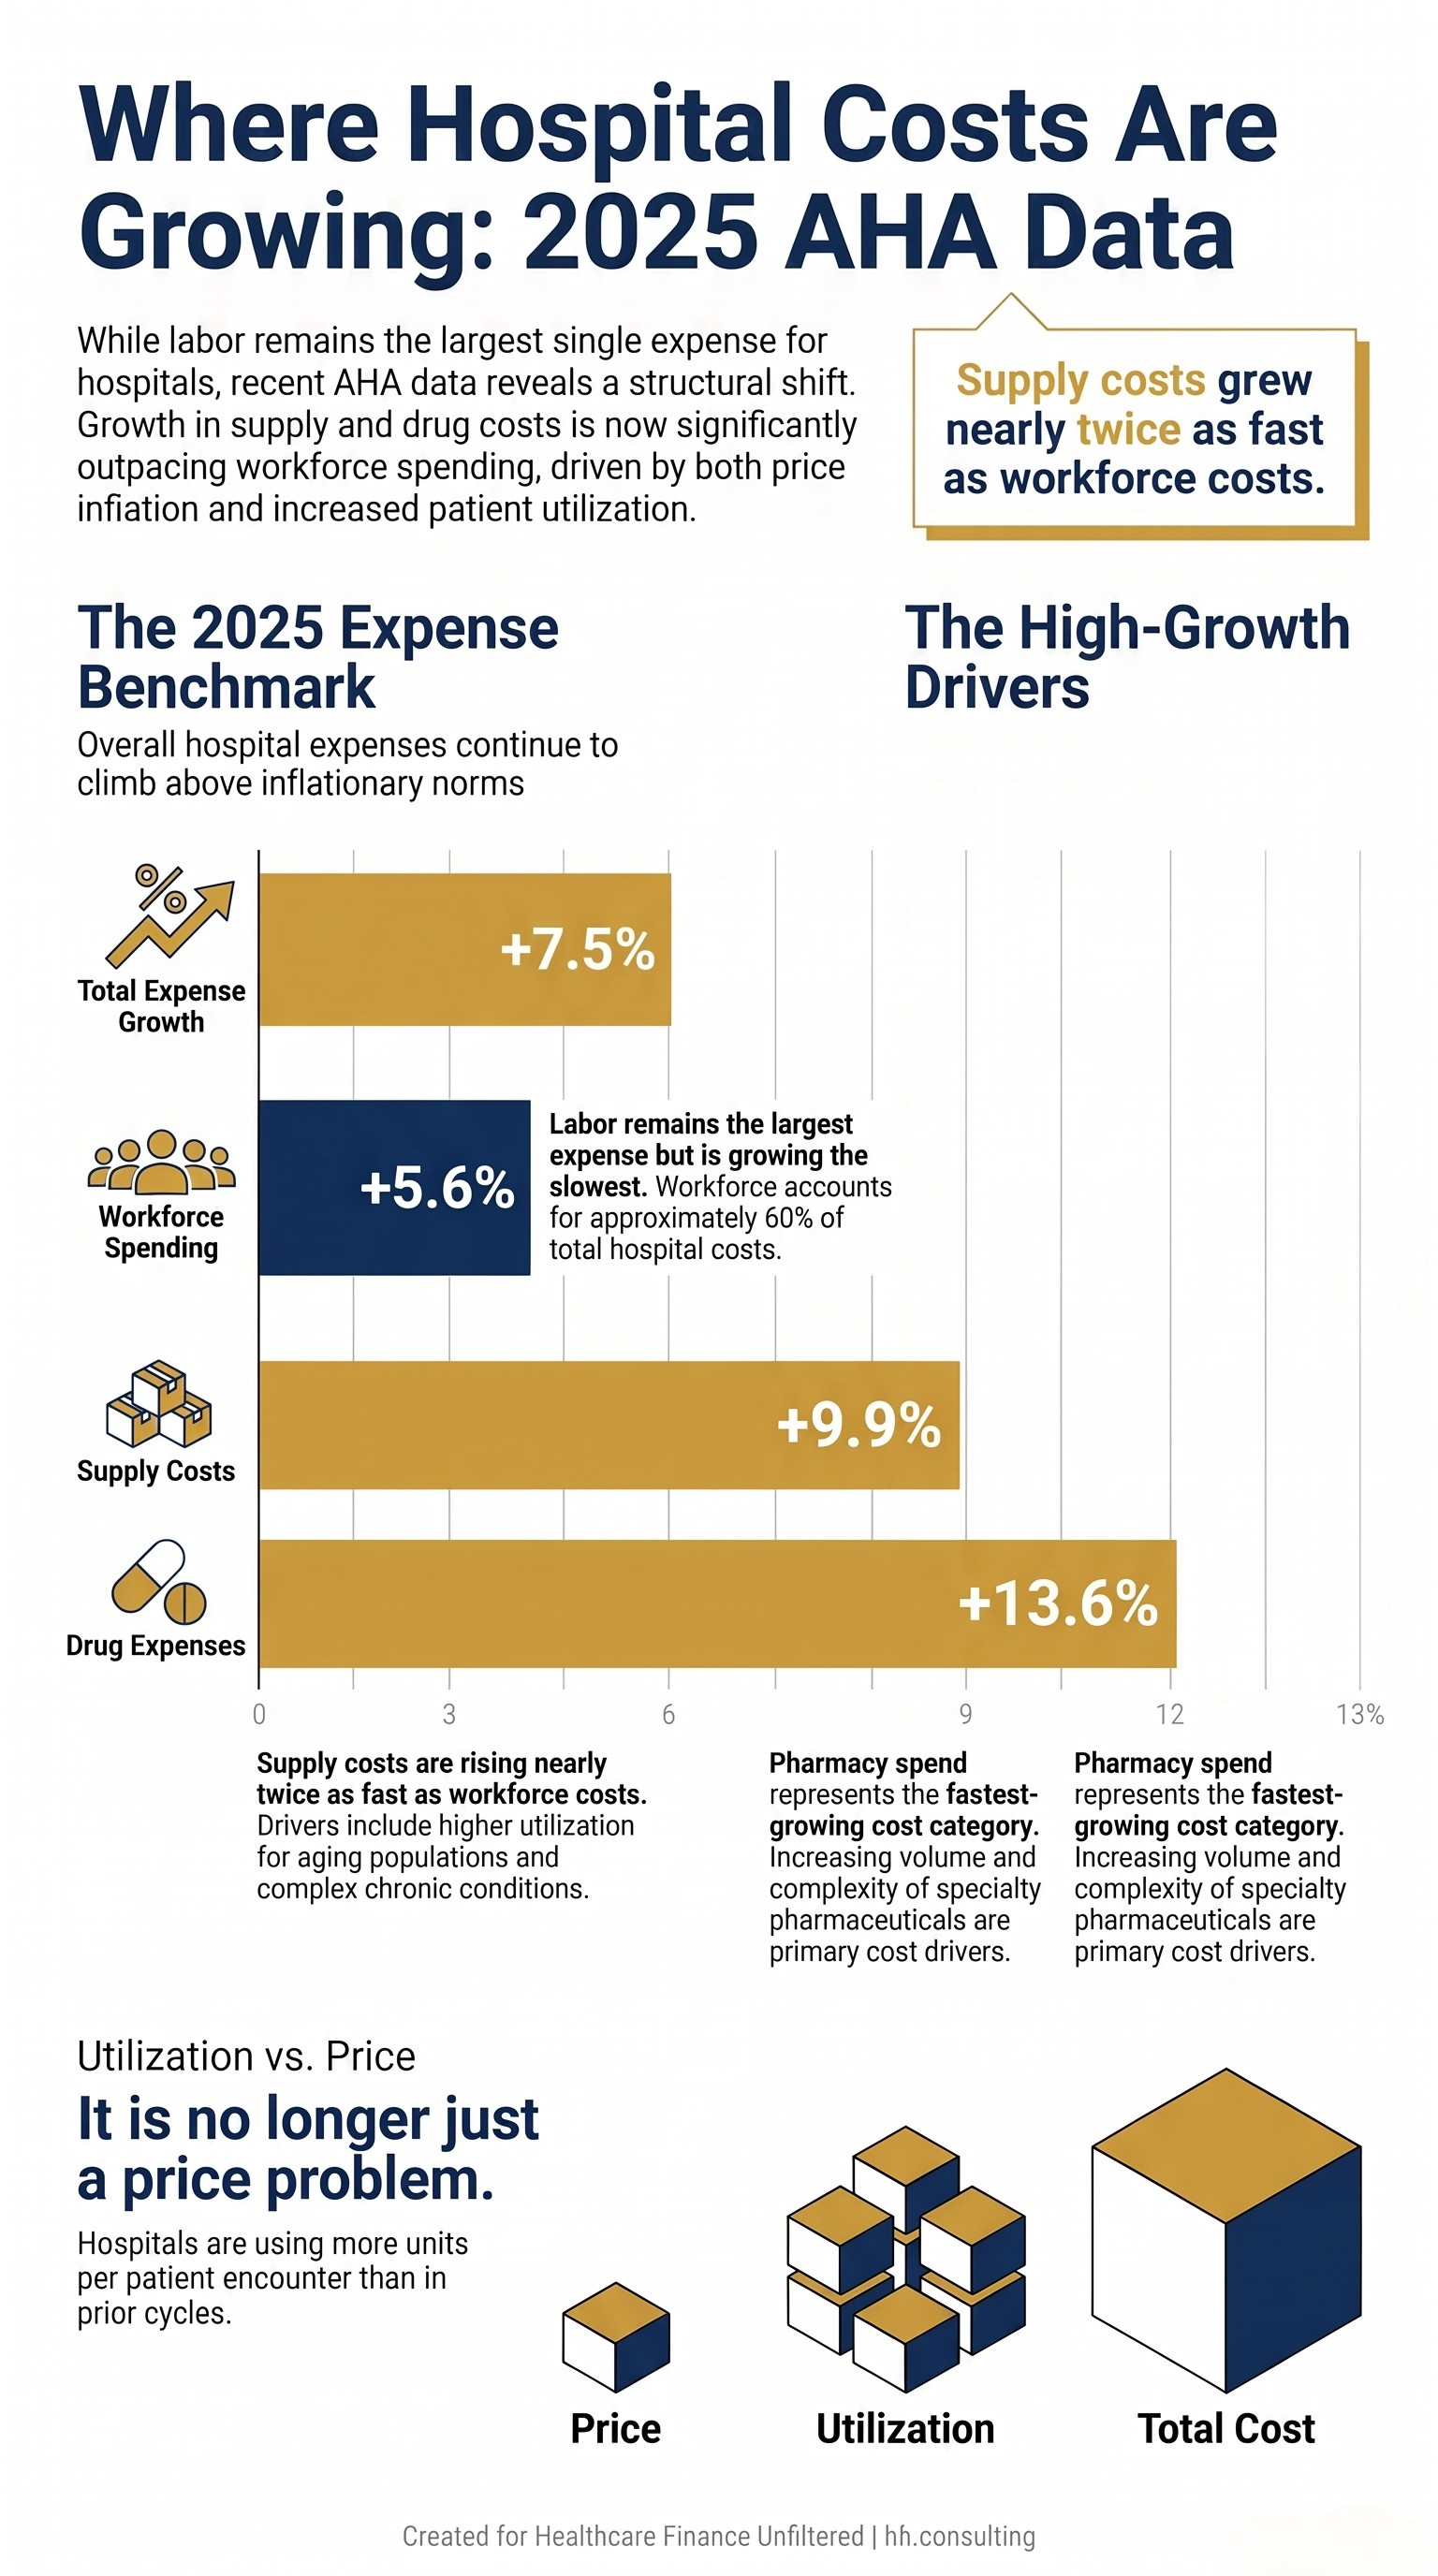
Bar chart comparing 2025 hospital expense growth rates: total expenses 7.5%, workforce 5.6%, supplies 9.9%, drugs 13.6%, per AHA Costs of Caring report.
The $43 Billion Administrative Tax Nobody Talks About in Budget Season
The AHA's most striking finding is not the labor number. It is the administrative spend figure: hospitals spent $43 billion in 2025 trying to collect payments from insurers for care already delivered. That breaks down to prior authorization delays, claims denials, repeated documentation requests, and evolving billing rules that require ongoing staff time and system investment to navigate.
From my time in payer operations, I can tell you that the complexity is not accidental. Coverage rules that shift mid-year, prior authorization requirements that expand quietly, documentation standards that vary by plan and line of business. These are not administrative failures. They are structural features of a reimbursement environment that places the burden of proof on the provider. Every hour a clinician spends pulling records for a PA request is an hour not spent on the floor. Every denial that requires a specialist to write an appeal letter is a direct transfer of clinical time to administrative overhead.
This connects to The Compliance Tax: How CMS Administrative Burden Became a Hidden Line Item Every Healthcare CFO Is Funding, which breaks down how to quantify this cost center in your own budget. The $43 billion figure is the industry aggregate. The question for your CFO team is what your system's share looks like when you fully load it.
The Performance Gap Is Not Widening, But That's the Wrong Metric
Kaufman Hall's Swanson made a point that deserves more attention than it typically receives. The gap between financially strong hospitals and financially stressed ones is not widening right now, but it is the largest it has ever been, and it is much larger than pre-pandemic levels. That is a different statement than "things are getting better."
A gap that is large and stable is still a large gap. Systems at the bottom of the distribution are operating with less margin for error than they ever have, at the exact moment when H.R. 1 Medicaid changes are expected to increase uninsured patient volume. The bigger changes, including work requirements for able-bodied Medicaid recipients, do not take effect until 2027. But the planning decisions being made right now will determine which systems have the flexibility to absorb that volume and which ones do not.
Fitch noted that this three-tier divide will continue, with well-capitalized systems reinvesting in outpatient expansion, technology, and M&A, while weaker providers face strain particularly in challenged markets. This is not a prediction. It is a description of a process already underway.
The systems on the Becker's strong-finances list, names like Froedtert ThedaCare (AA), St. Elizabeth Medical Center (AA, 83% inpatient market share), and UCHealth (AA+), are not just surviving the current environment. They are using it to widen their strategic position. They are investing in outpatient access points, acquiring adjacent providers, and deploying AI in revenue cycle in ways that will compound their advantage over the next several years.
For context on what that investment pattern looks like operationally, see Health System Cost Control in 2026: What Still Works, What Needs Updating, and What CFOs Should Do Now.
Rural and Safety-Net Systems Face a Different Equation
The bottom tier of the three-tier divide is not uniformly defined, but it skews heavily toward rural providers and safety-net systems. Swanson was explicit: the pressure is falling hardest on small organizations that tend to serve more rural and lower-income populations. These systems face a convergence of structural disadvantages that larger urban systems do not.
Their payer mix is more Medicaid-dependent. Their balance sheets are thinner. Their labor markets are tighter because they compete with larger regional systems for the same clinical staff. Their supply chains often lack the scale leverage that comes with a larger purchasing footprint. And their administrative infrastructure is frequently stretched across a smaller revenue base, which means the $43 billion administrative burden problem hits them at a higher percentage of net revenue than it does for a multi-billion-dollar system.
The AHA report makes a point that is easy to overlook in aggregate data: roughly 56% of hospital costs are tied to service lines where reimbursement consistently falls short of the cost of care. Behavioral health, obstetrics, infectious disease, burns and wounds. These service lines are disproportionately represented in rural and safety-net settings. A critical access hospital running a labor and delivery unit at a negative margin is not making a strategic choice. It is fulfilling a community obligation that no one else will.
For a detailed look at how these systems are managing the financial math, see the earlier piece on Hospital Workforce Cost Control: CFO Guide to Smarter Pay Strategies and Productivity Tools.
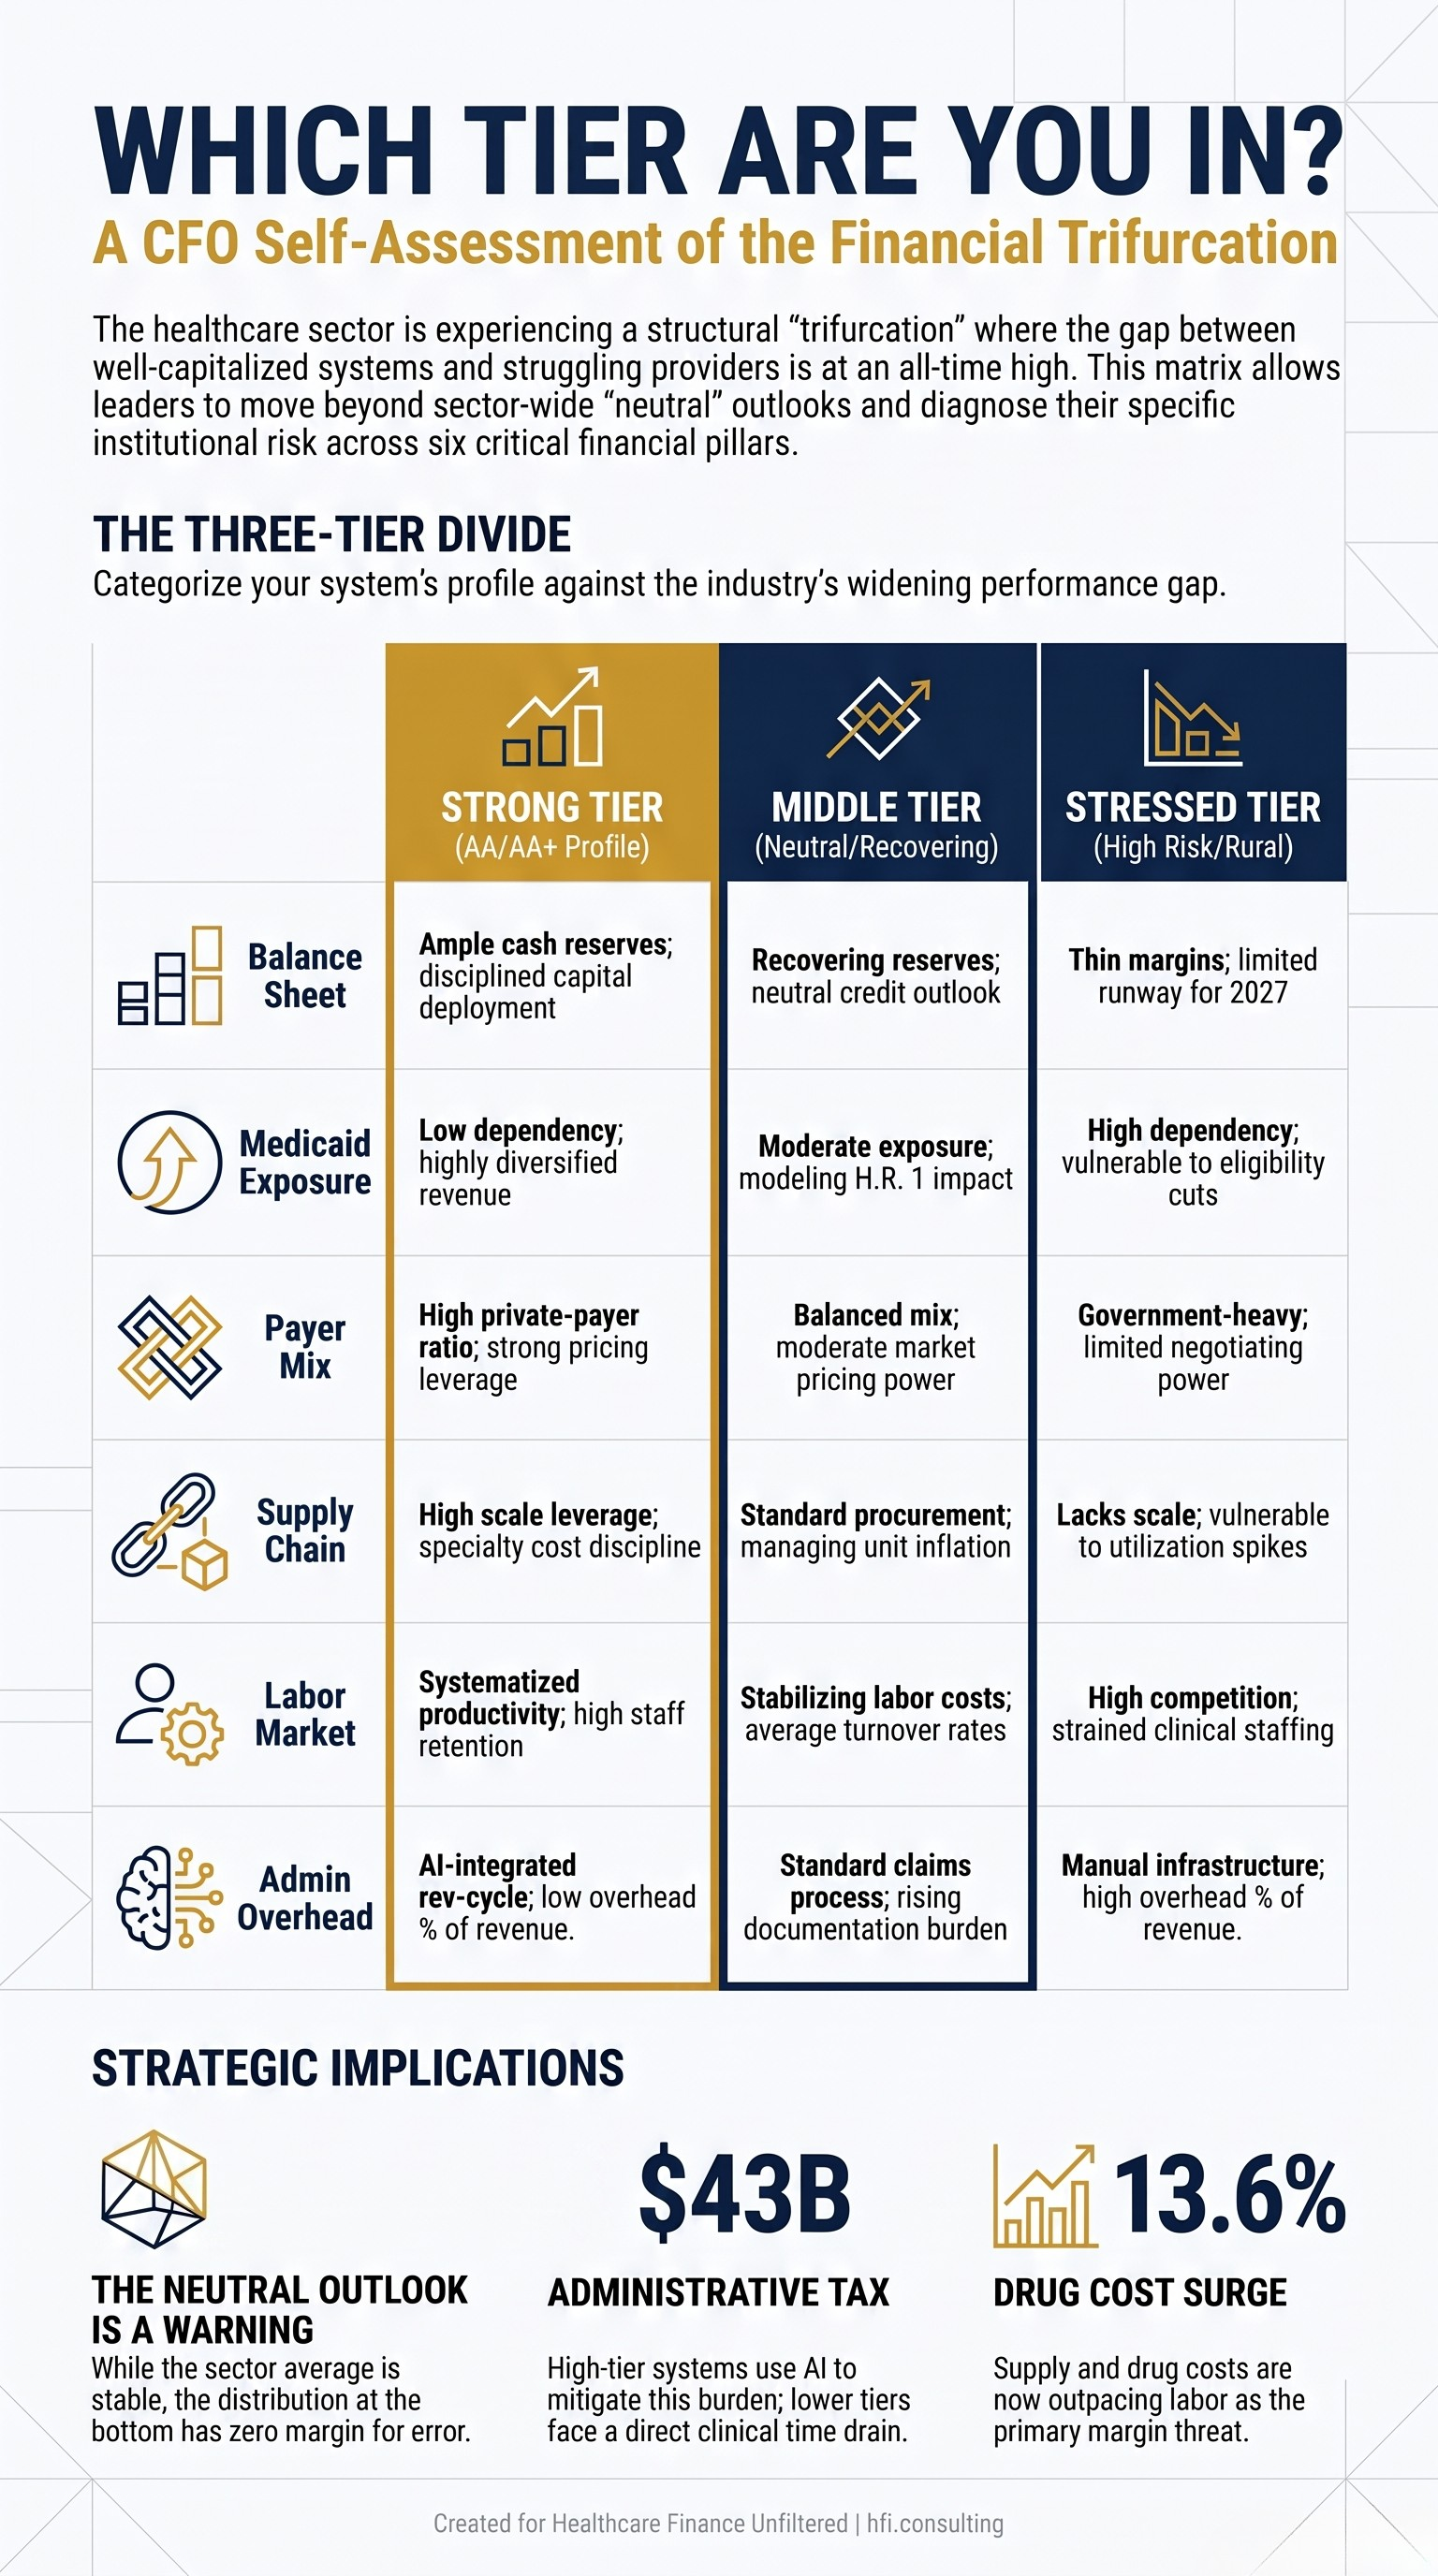
Three-column self-assessment matrix helping hospital CFOs identify their position in the 2026 three-tier performance divide: strong, middle tier, or financially stressed.
What Finance Leaders Should Be Doing Right Now
The Fitch, Kaufman Hall, and AHA data converge on a consistent message: the runway for preparation exists, but it is not unlimited. Medicaid's major eligibility changes do not hit until 2027, but balance sheet positioning, cost structure work, and payer mix modeling need to be underway now to have any practical effect when that pressure arrives.
The systems that will navigate this well share a few characteristics. They are running scenario models that assume multiple Medicaid enrollment outcomes rather than a single point estimate. They are quantifying their administrative burden cost as a budget line item, not a vague overhead category. They are reviewing contribution margin by service line with enough granularity to distinguish between strategic losses (services you sustain for community mission) and operational losses (inefficiencies that are fixable). And they are stress-testing their capital plans against a range of reimbursement assumptions that include rate deterioration, not just the base case.
If your current budget model still reflects a single Medicaid scenario, you are not planning for this environment. You are hoping it resolves favorably.
HFI Consulting works with health system finance teams on the scenario modeling, margin analysis, and cost structure work that this environment requires. If you want a framework built around your system's specific payer mix and service line profile, visit hfi.consulting to learn more.
The Neutral Outlook Is Not Reassuring. It Is a Warning.
Fitch's neutral sector outlook means the agency expects the average system to continue improving. It does not mean every system will improve. The three-tier divide language in the same report makes clear that the distribution around that average is wide, and the systems at the bottom of that distribution are operating with the least flexibility at the moment when flexibility matters most.
The $43 billion administrative burden, the 13.6% drug cost increase, the Medicaid exposure from H.R. 1, the labor market that has not resolved: none of these are surprises. What varies is whether a system's finance leadership is treating them as line items to manage or structural forces to model.
The difference between the systems on the strong-finances list and the systems facing downgrades is not primarily luck or geography. It is decisions that were made three to five years ago about balance sheet management, cost structure discipline, and revenue diversification. The decisions being made right now will define the next tier of that list.
For CFOs who want a cleaner view of how their own cost structure maps to these headwinds, see No Margin, No Mission: What the Hospital Pricing Report Means for Health System CFOs.
HFI Consulting helps health system and medical group finance leaders build the financial frameworks, margin models, and strategic planning tools their current environment actually requires. Learn more at hfi.consulting
P.S. Where does your system sit in this three-tier divide? If you're building Medicaid scenario models right now, I'd like to hear what assumptions you're using for enrollment drop-off. Hit reply and tell me what you're planning for.
