
Contribution Margin Integrity: The CFO Framework for Catching What Your Dashboard Is Missing
Your aggregate dashboard shows green. Your service line wiring may be crossed. Here is the framework that closes the gap.
Your service line capital decisions are being finalized right now. Payer contract negotiations for 2027 are opening. And the contribution margin data behind every one of those decisions may be structurally wrong in ways your dashboard will never show you.
This is not a revenue cycle problem. It is not a denial management gap. It is a deeper failure: the absence of an organizational discipline that validates contribution margin data at the case level before anyone acts on it. That discipline has a name. It is Contribution Margin Integrity. And most health systems are operating without it.
The Danger of the Aggregate Dashboard
During a construction project at one of the hospitals where I worked in cost accounting, leadership decided to temporarily combine Interventional Radiology(IR) and the Cath Lab into a single reporting unit. The operational logic made sense. The financial consequences did not.
I raised the flag before the first month closed. My director told me to run the reports. By the time the data came back, the damage was already in the books.
The combined department's total revenue looked fine. Volume metrics showed a busy unit. Nothing on the executive dashboard suggested a problem. But when I started pulling the thread at the service line level, Cardiology was being credited for high-dollar IR procedures that had nothing to do with it. IR was absorbing the supply costs without the matching revenue. Productivity figures for both departments were built on a foundation that had never been correctly aligned.
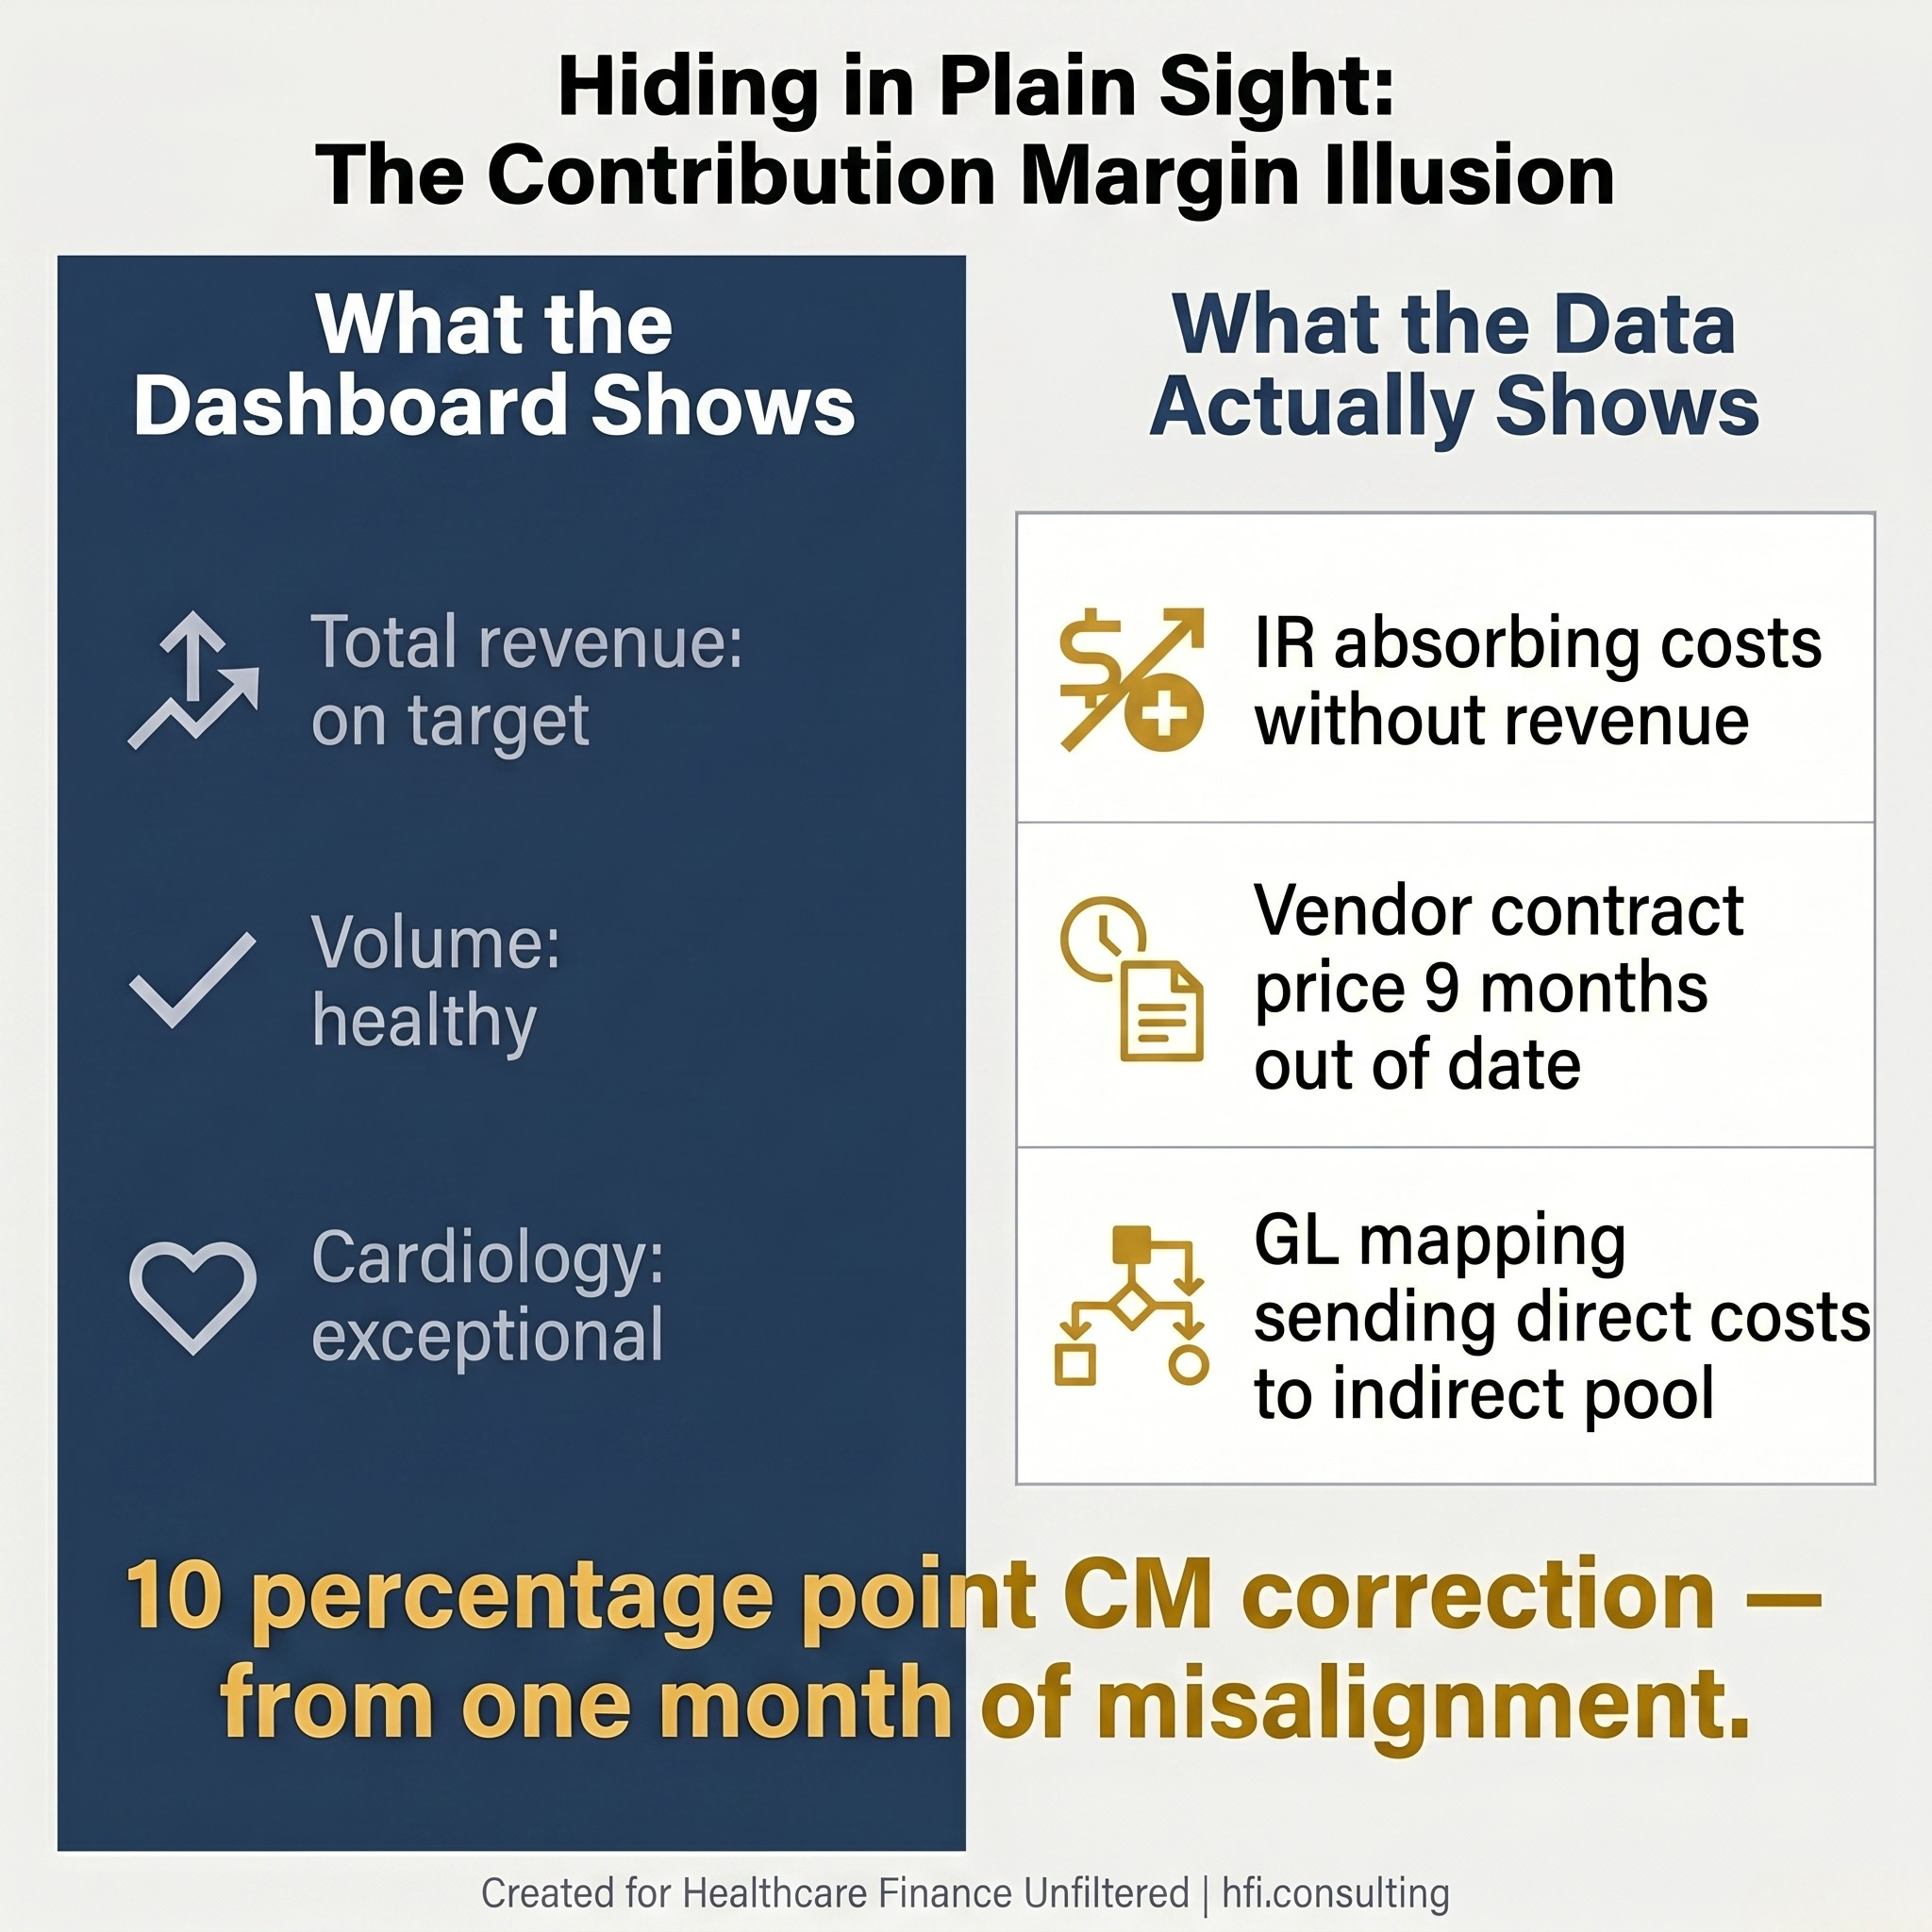
Split comparison graphic showing the gap between what an aggregate dashboard shows and what case-level cost accounting reveals in a misaligned service line.
Correcting the record took two weeks of working backwards through preference cards, physician-level billing data, and cost center mapping. When the dust settled, IR's contribution margin had moved 10 percentage points. Cardiology went from looking exceptional to looking average. My concerns were validated. Leadership called it a good catch.
It was not a difficult catch. It was basic cost accounting, done correctly, by someone who knew what to look for.
The most dangerous phrase in healthcare finance is "the numbers look fine." Aggregate dashboards are designed to surface major variances. They are not designed to detect structural misalignment at the service line level. Total revenue can be whole while contribution margin is completely wrong. A department can appear to be a cash cow for quarters at a time while another quietly absorbs costs it was never supposed to carry.
This is not a hypothetical risk. It is the default condition in any health system where multiple failure modes exist simultaneously in the same service line, and nobody has connected them into a single picture.
What Contribution Margin Integrity Actually Means
Contribution Margin Integrity is the organizational discipline of validating that your contribution margin data is structurally sound at the case level before anyone makes a capital decision, a staffing decision, or a payer contract decision based on it.
It is not a software feature. It is not an audit function that runs during month-end close. It is a continuous governance practice that sits at the intersection of clinical data, supply chain cost, and billing logic.
The reason this discipline needs a name is that the individual problems it addresses have historically been owned by separate departments with no formal accountability to each other. Revenue cycle catches denials. Supply chain manages contracts. Cost accounting produces service line reports. And the CFO sees a rolled-up dashboard that looks fine because nobody in any of those three departments has a mechanism to see across all of them simultaneously.
When Contribution Margin Integrity is absent, the aggregate looks clean. The structural rot accumulates invisibly until someone starts pulling the thread.
The Three Failure Modes That Compound
Healthcare finance leaders have been reading about these problems individually for years. What the industry has not clearly named is what happens when three or four of them run simultaneously in the same service line, undetected, for eighteen months.
The first failure mode is charge capture breakdown at the point of care. Implants that are used but not documented. Charges that never enter the billing system. Revenue that disappears before anyone starts looking for it. For a mid-sized surgical service line, this alone can represent $90,000 to $220,000 in annual revenue that was earned but never collected. (Full breakdown: How Much Revenue Is Your Hospital Losing to Implant Billing Gaps?)
The second failure mode is chargemaster and vendor contract misalignment. A vendor contract renews. The per-unit cost changes. Purchasing updates the purchase order system. Nobody updates the chargemaster. For the next several quarters, the cost accounting system uses the old contract price while actual acquisition costs accumulate at the new rate. The service line appears more profitable than it is. Leadership makes expansion decisions based on a margin number that stopped being accurate the day the contract renewed. (Full framework: Implant Costs Are a Contribution Margin Problem, Not a Billing Problem)
The third failure mode is GL mapping error. A new cost center is created during an expansion or system migration. The chart of accounts mapping defaults to indirect. The cost is actually direct. The service line's contribution margin is understated. The indirect cost pool is overstated. Both errors persist quietly until a trained cost accountant notices that the cost center classification does not match the clinical workflow it was built to track. (See: Contribution Margin Errors Are Hiding in Plain Sight)
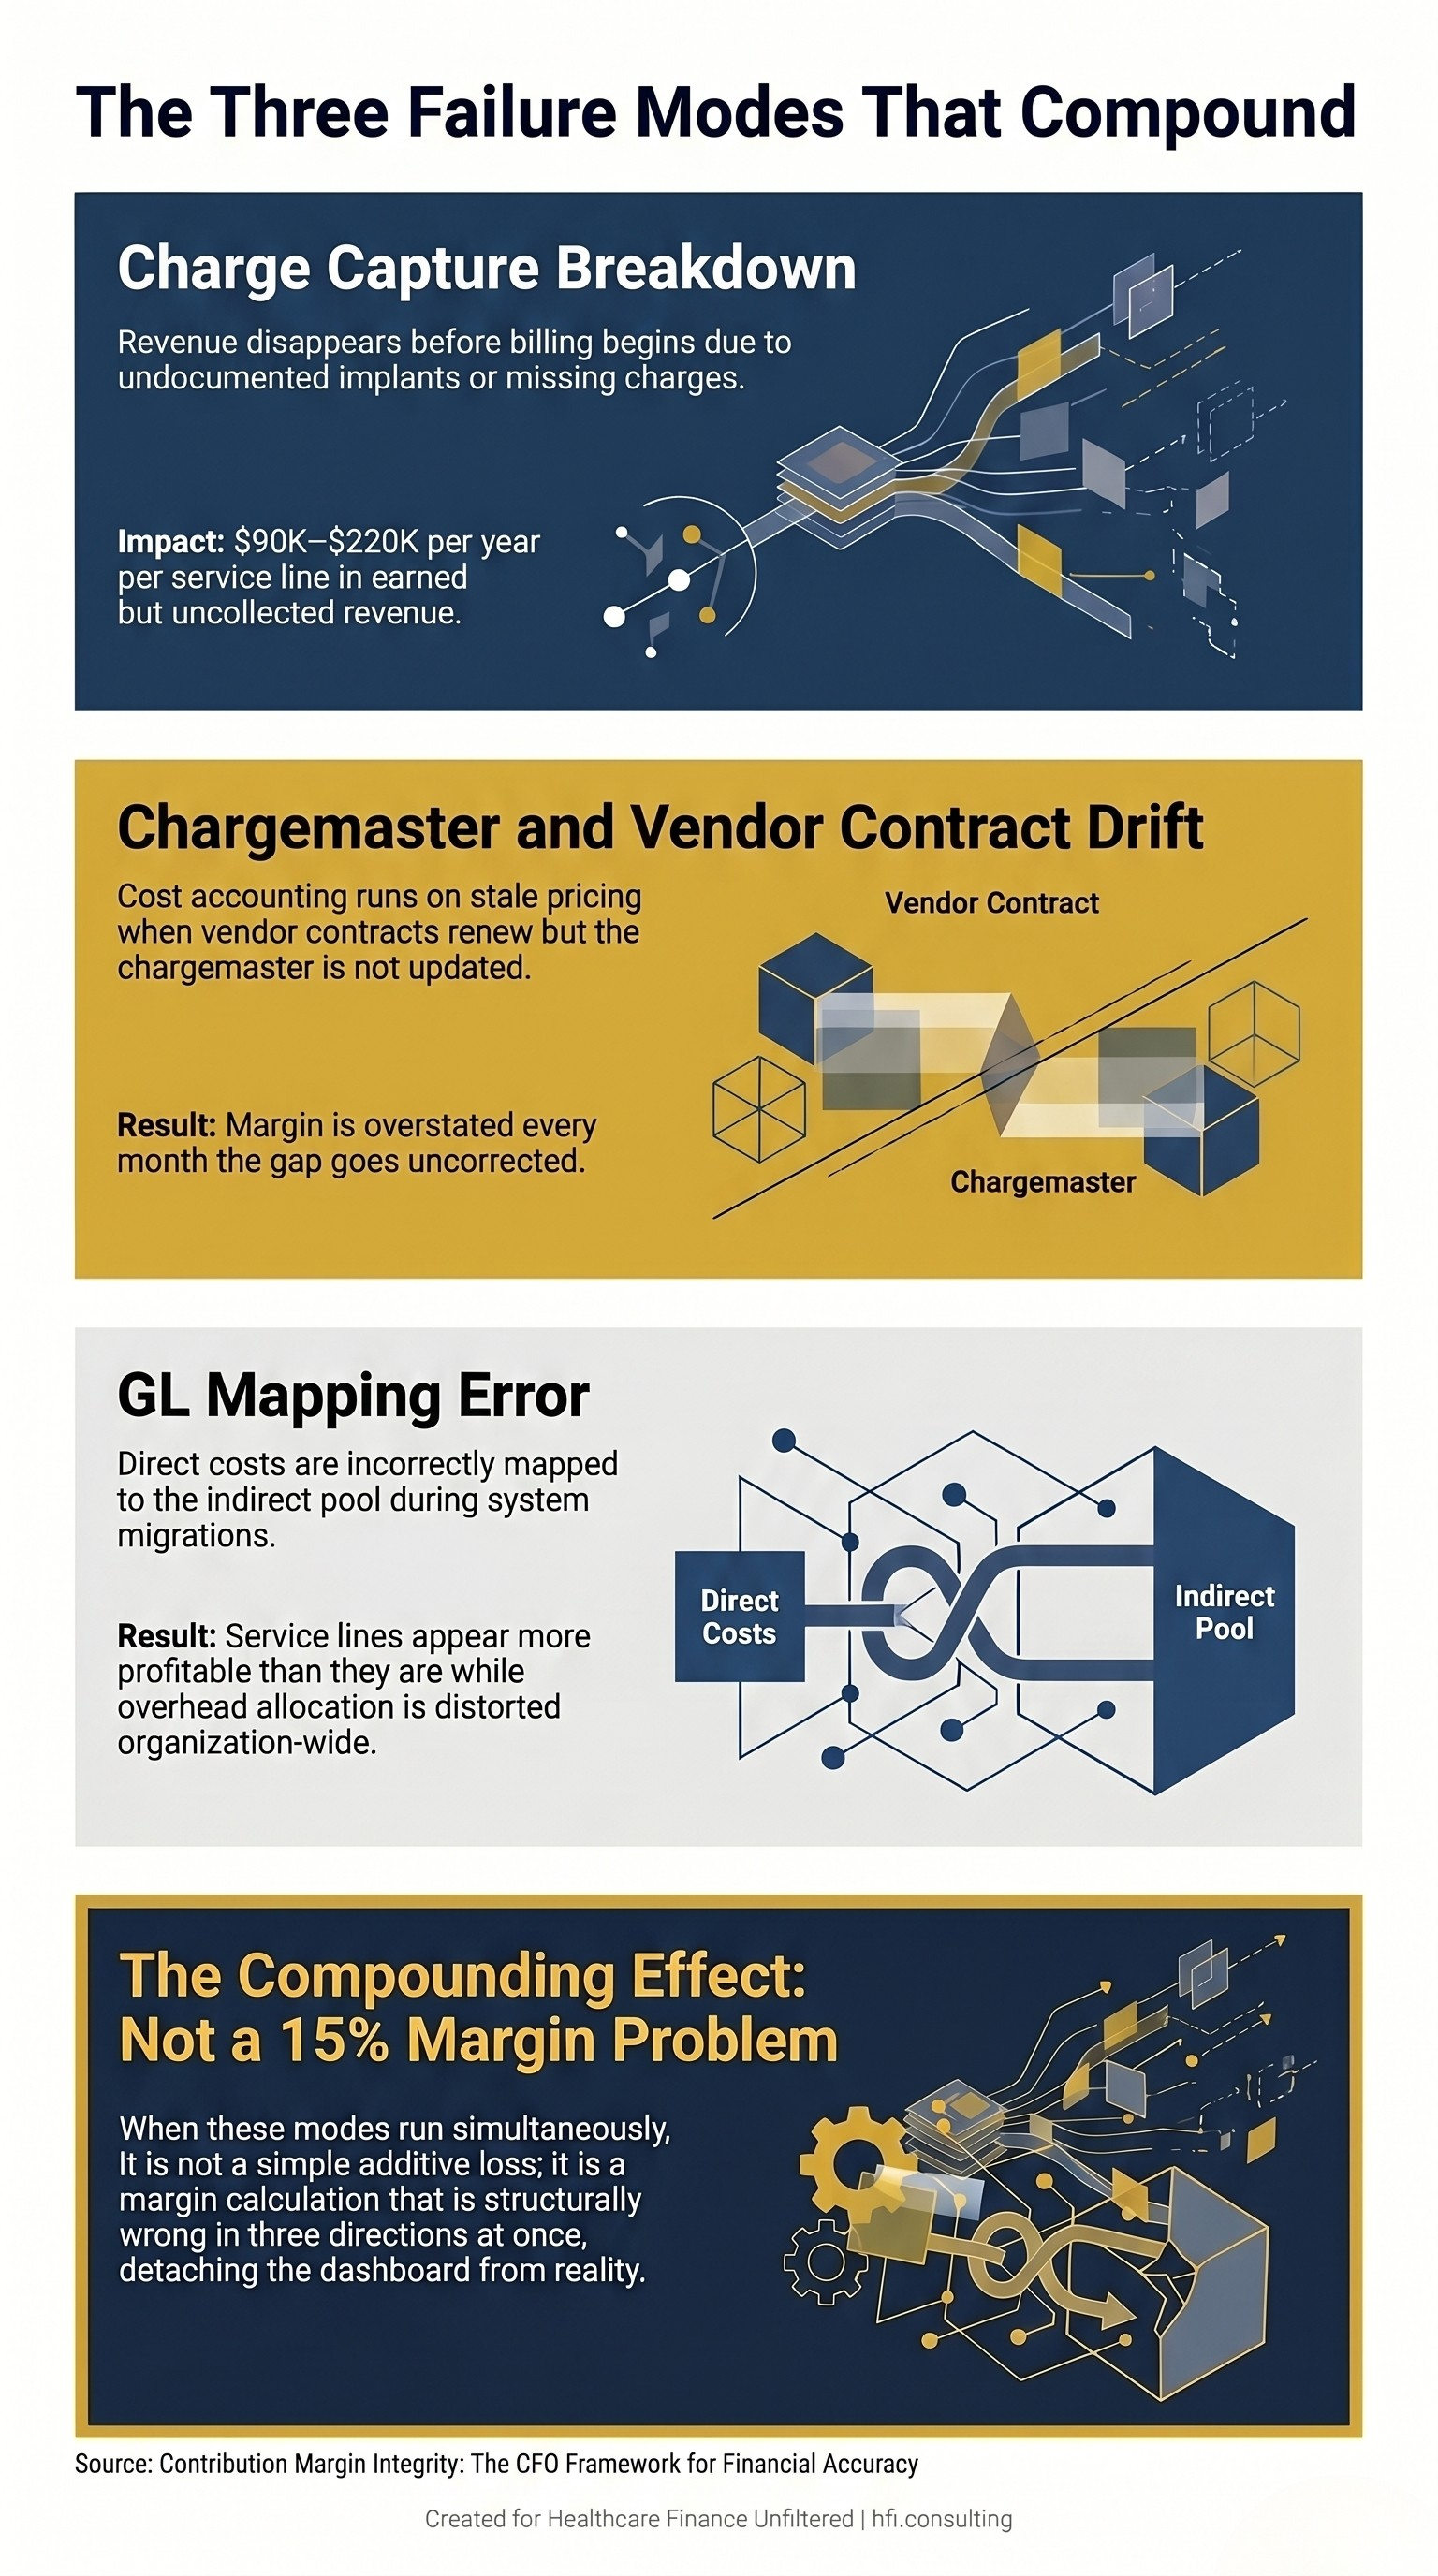
Stacked diagram showing three simultaneous contribution margin failure modes in healthcare service lines and their compounding financial impact.
Here is what the compounding looks like in practice. If your service line is running a 10% charge capture gap, a 3% chargemaster misalignment, and a 2-point GL mapping distortion, you are not facing a 15% margin problem. You are facing a margin calculation that is structurally wrong in three directions at once, where each error interacts with the others in ways that make the aggregate dashboard look normal while the true margin is increasingly detached from reality.
This is precisely what happened in the IR/Cath Lab scenario I opened with. Total revenue was whole. Volume metrics were healthy. Cardiology looked like a star performer. IR looked like an expensive underperformer. Leadership had been reading the wrong narrative for a full month before anyone pulled the thread. Nobody in any single department had visibility across all three dimensions simultaneously.
So much of cost accounting is just doing your job. The problem is that fewer organizations have someone whose job it is.
Who Owns This?
This is the question none of the previous articles in this series answered directly. And it is the question that prevents most organizations from acting.
In a high-performing health system, Contribution Margin Integrity is not owned by a single person or department. It operates as a shared governance model with three distinct lines of defense.
The executive owner is the CFO. Not because the CFO is running the quarterly reconciliation, but because the CFO is the one making capital allocation decisions based on service line margin data. When those decisions are built on structurally wrong contribution margin, it is a CFO-level failure. The board is seeing numbers the CFO has presented. The accountability runs upward.
The operational owner is the Director of Revenue Integrity. This is the modern bridge between finance and clinical operations. Revenue Integrity houses the Chargemaster Coordinator, Revenue Auditors, and Clinical Documentation Improvement specialists. Their job is to ensure that when a clinician scans a stent or documents a procedure, the code generated maps to the correct revenue code, the correct cost center, and the correct payer contract. They build and maintain the plumbing that prevents silent leaks between service lines.
The analytical owner is the Manager of Cost Accounting or Decision Support. While Revenue Integrity builds the pipes, Cost Accounting tests the water. This team owns the RVU models, the cost allocation methodologies, and the monthly variance triggers. They are looking at net margin down to the patient, DRG, and physician level. They are the ones who notice when an IR physician's NPI is appearing on Cardiology revenue codes. They are the ones who catch chargemaster misalignment nine months after the vendor contract renewed.
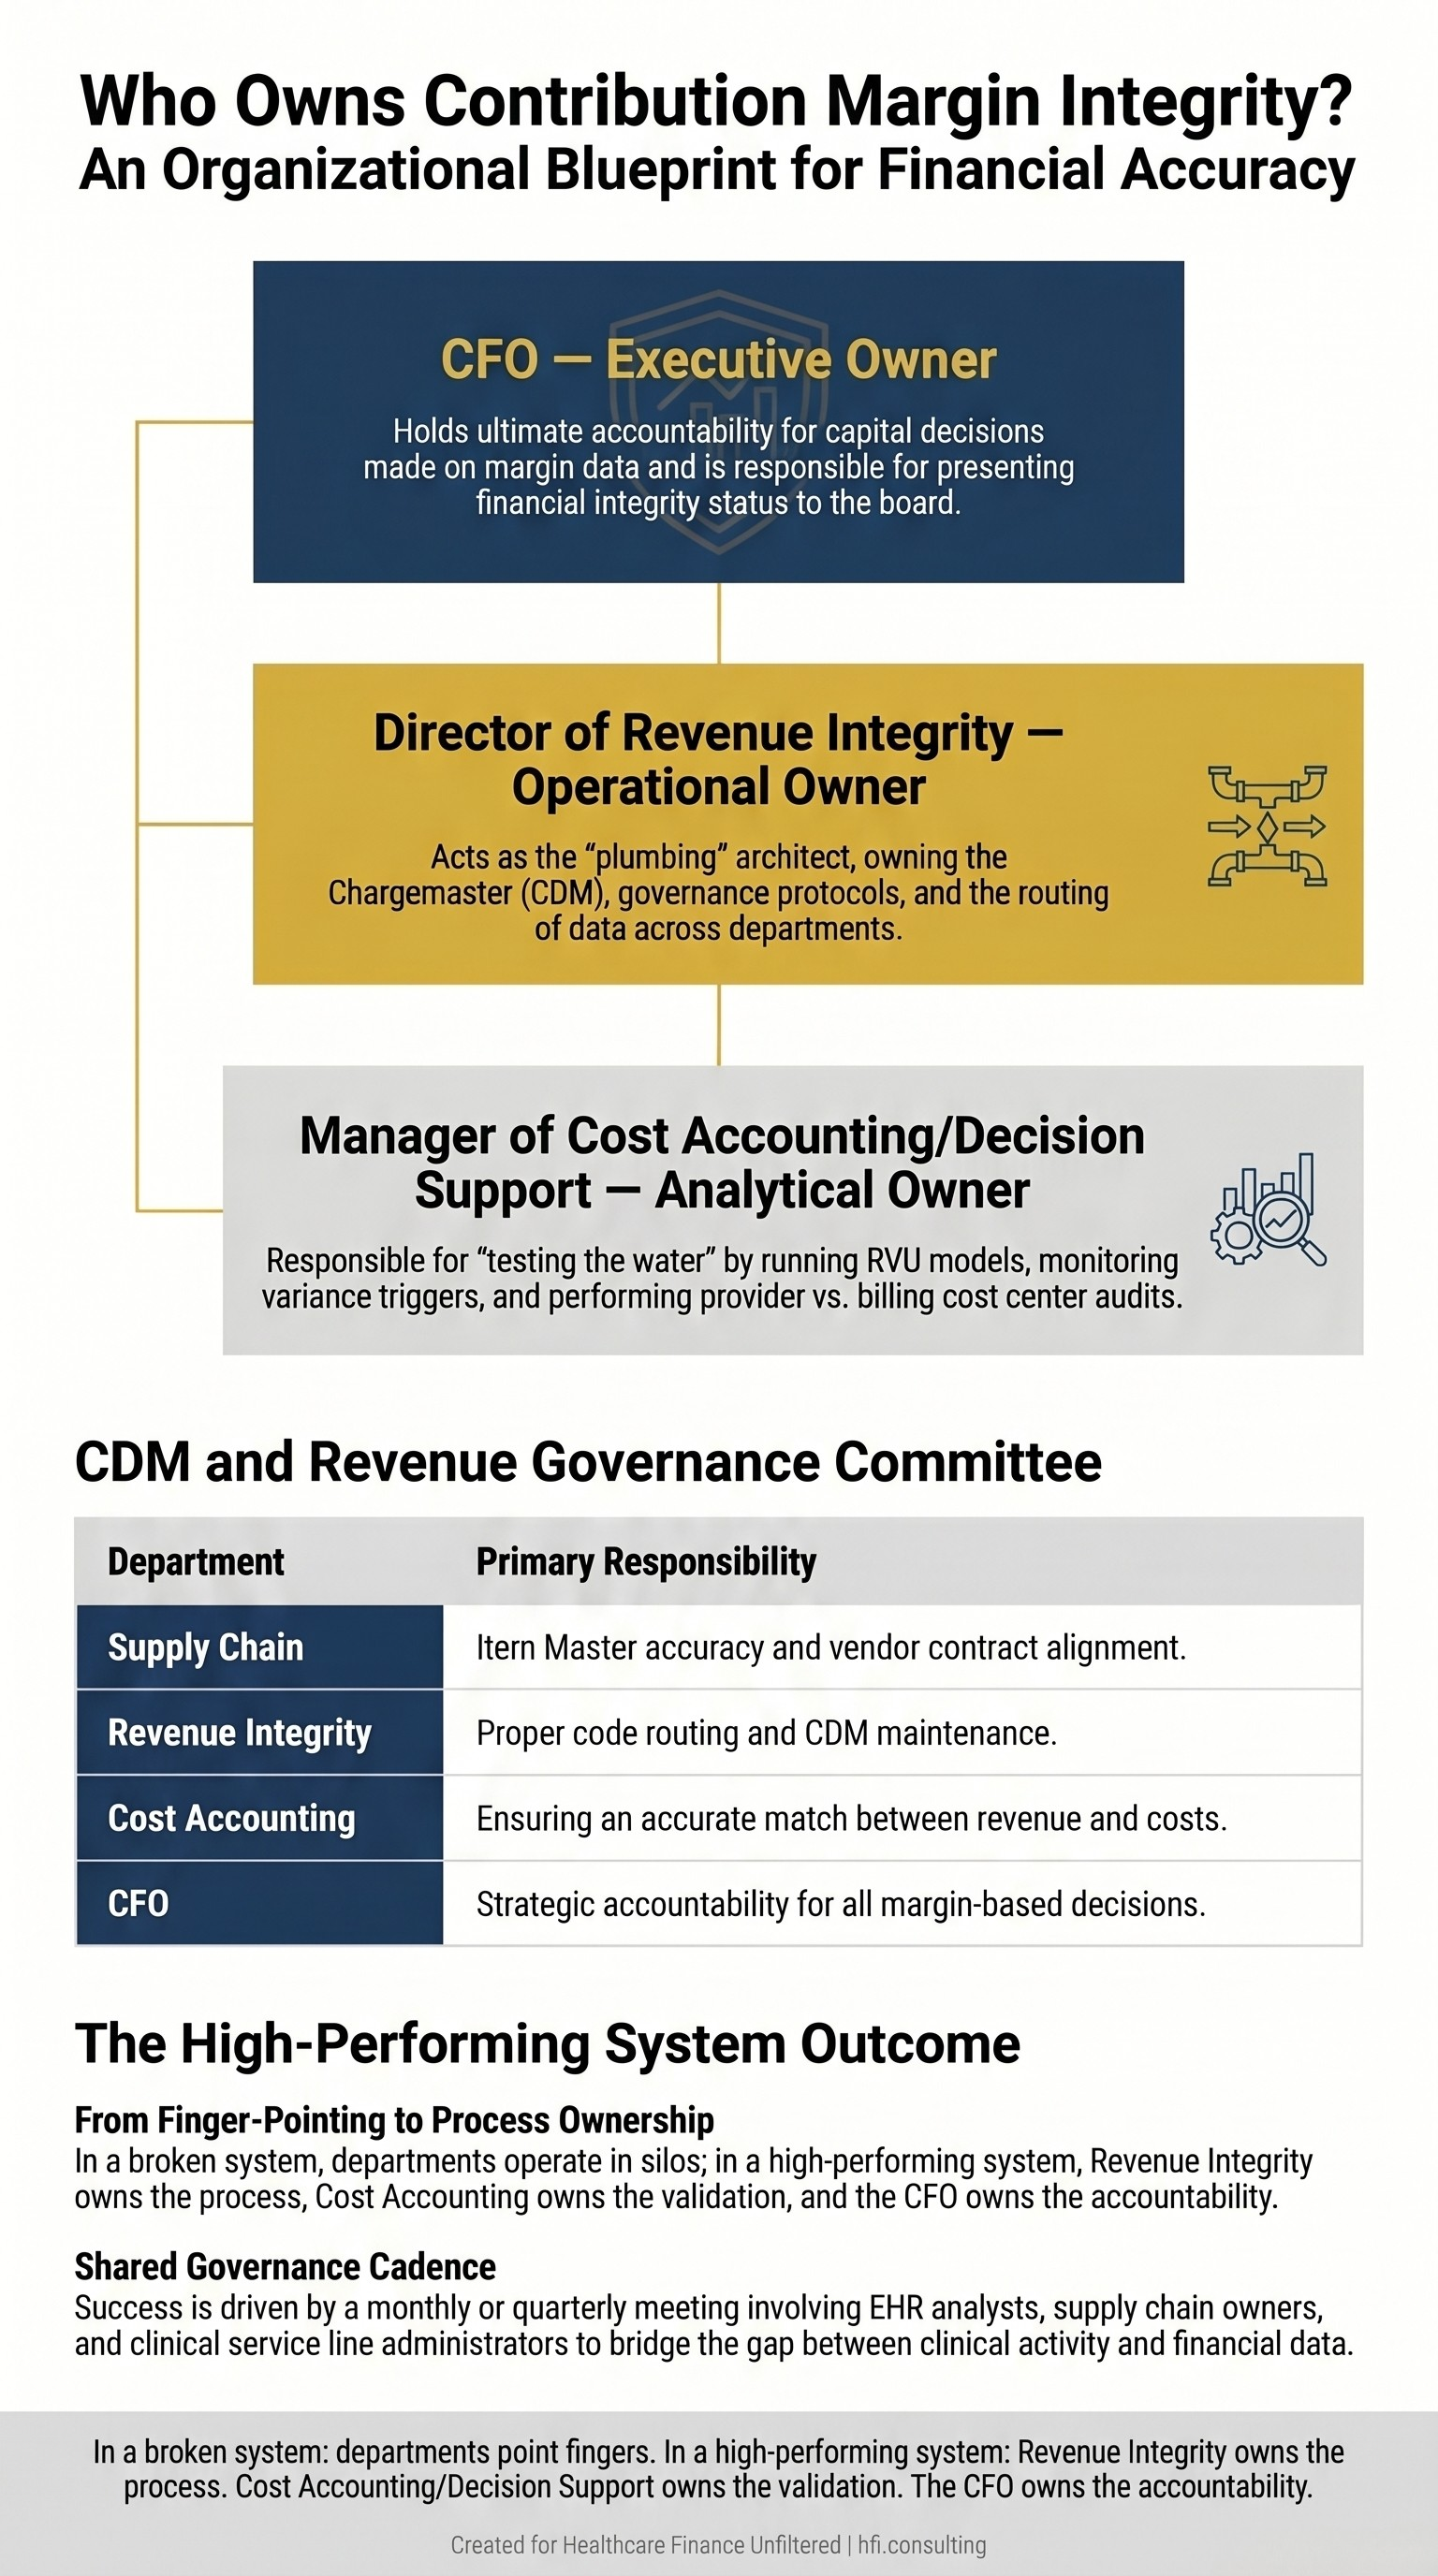
Three-tier organizational governance diagram showing the executive, operational, and analytical owners of Contribution Margin Integrity in a high-performing health system.
In health systems that do this correctly, these three owners do not just talk when something breaks. They meet formally, on a monthly or quarterly cadence, in a CDM and Revenue Governance Committee. That committee includes Revenue Integrity as chair, Cost Accounting, Supply Chain and Item Master ownership, EHR Application Analysts who build the preference cards, and Clinical Service Line Administrators for each high-cost procedural area.
The shared governance model works because contribution margin requires a real-time marriage of clinical data, supply chain cost, and billing logic. If any one department tries to own it in a silo, the other two dimensions go unvalidated.
In a health system that is struggling with this, departments point fingers when a charge code misalignment surfaces. That is a billing issue. That is an IT problem. That is supply chain's responsibility. In a health system doing it right, Revenue Integrity owns the process, Cost Accounting owns the validation, and the CFO owns the accountability.
If you are reading this and realizing that your organization does not have this governance structure, you are not alone. The cost accounting function has been systematically reduced across the industry over the past decade, and the Revenue Integrity function in many organizations is focused almost entirely on denial management rather than upstream margin validation.
Rebuilding this capability is precisely the kind of targeted engagement I do with provider and payer finance teams at hfi.consulting. If you want to understand what a Contribution Margin Integrity assessment would look like for your organization, reply to this email or visit hfi.consulting to connect directly.
The Diagnostic Entry Point
Most organizations do not need a full infrastructure rebuild to start. They need a single diagnostic question that reveals how much of the problem already exists in their current financial statements.
Here is that question: when did someone last reconcile your top ten implant costs against current vendor contracts, cross-referenced against actual chargemaster entries, for your three highest-volume surgical service lines?
If the answer is "I would need to check," you have a Contribution Margin Integrity problem that has not been quantified yet.
The diagnostic process from there is direct. Start with the highest-cost, highest-volume service line. Pull case-level cost data for the past 90 days. Cross-reference surgical case logs against billed charges. Compare active vendor contract pricing against current chargemaster entries for your top implant categories. Run a performing provider versus billing cost center audit for any procedure category where two departments share CPT code overlap.
In my work doing cost accounting at UF Health Jacksonville and across seven hospitals at Ascension, the cases where the math did not work at the case level were almost always implant-related. Either the cost was loaded incorrectly, the charge was not captured at the point of care, or a vendor had adjusted pricing and no one had updated the system. Those are the three failure modes. They present the same way every time.
What you find in a 90-day case-level audit tells you whether you are looking at an isolated data issue or a structural problem that has been compounding for months. That distinction determines whether you need a process fix, a system configuration correction, or a governance rebuild.
(For the service line capital evaluation framework that sits on top of this diagnostic, see: Service Line Financial Assessment: The CFO's Framework for Capital Decisions That Actually Hold Up. And for the measurement framework to use once your data is clean: Why Your Orthopedic Service Line CM% is 400 Basis Points Below Benchmark)
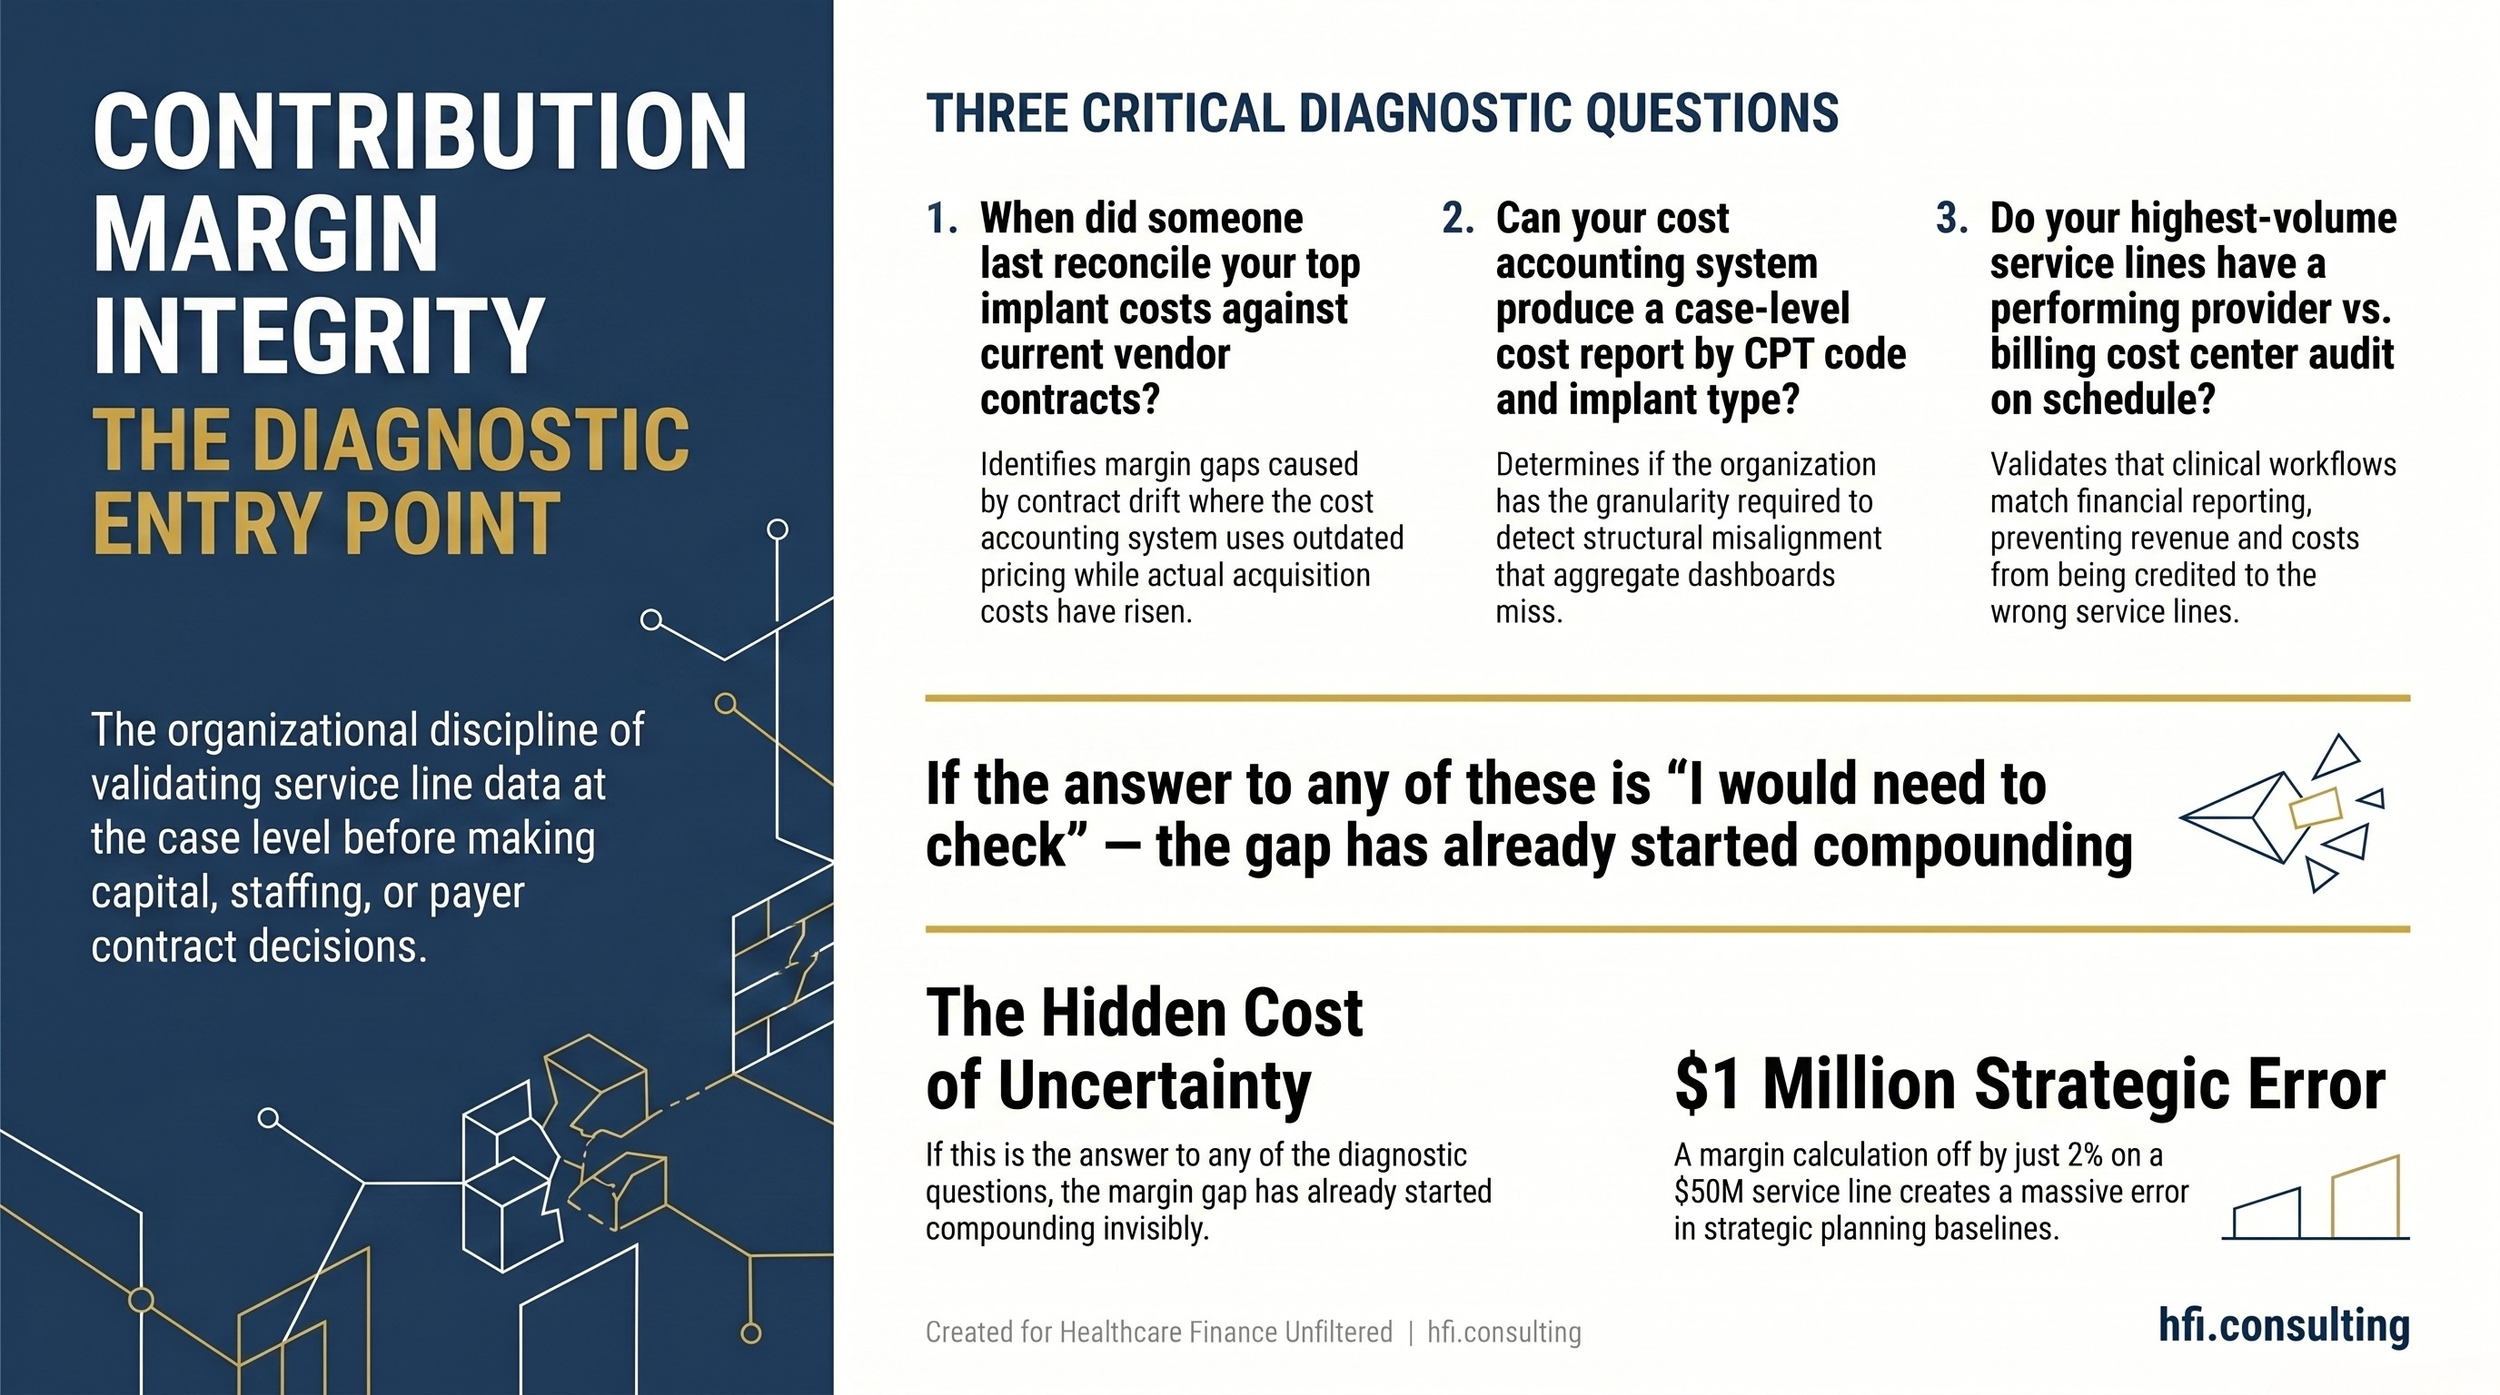
diagnostic framework card showing three entry-point questions for assessing Contribution Margin Integrity in a health system's surgical service lines.
Why This Quarter Matters
Health system CFOs are in active capital allocation cycles right now. Service line expansion requests are being evaluated. Physician compensation models are being redesigned. Payer contract negotiations are opening for 2027.
Every one of those decisions rests on service line contribution margin data. If that data has not been validated at the case level, those decisions are built on something that looks like analysis but is not.
The AHA's 2026 Costs of Caring report documented supply cost growth of 9.9% in 2025. Operating margins remain in the 2-3% range for most health systems. In that environment, a contribution margin calculation that is off by two percentage points on a $50 million service line is a $1 million error in your strategic planning baseline. That is not a rounding issue. That is a capital decision made with the wrong instrument.
The facilities that invest in Contribution Margin Integrity now will make better capital decisions over the next 12 months. They will catch vendor contract drift before it becomes an 18-month margin gap. They will identify GL mapping errors before they distort three years of service line benchmarking. They will have the governance structure to prevent the kind of service line misalignment that takes two weeks and a full preference card audit to untangle.
That structure does not require a large team. It requires three defined owners, a quarterly governance cadence, and someone with the technical training to know what a contribution margin variance looks like when it is caused by a structural error rather than an operational one.
Healthcare Finance Unfiltered covers the operational and financial strategy issues that do not fit neatly into industry talking points. If this was useful, subscribe to get new articles directly to your inbox. And if your service lines have contribution margin patterns that do not reconcile at the case level, visit hfi.consulting to learn how I work with provider and payer finance teams on targeted cost accounting and margin integrity assessments.
P.S. Which of the three failure modes is most likely running undetected in your organization right now: charge capture gaps, chargemaster and vendor contract misalignment, or GL mapping errors? Hit reply and tell me what you are seeing. I read every response, and the answers shape what I write next.