
Providence, Ascension, Tenet, and CHS took years, not quarters. Here is what finance should measure at each stage.
Your board wants to know when the margin comes back. The fiscal 2026 results are in, and the honest answer is measured in years.
Ascension lost $3.0 billion from operations in fiscal 2023. Three years later, it still reported a $120 million operating loss. That is what a working turnaround looks like.
Title graphic reading Turnarounds take years, not quarters, with the health systems Providence, Ascension, Tenet, and CHS named in the subtext
Every turnaround here took years, and none of them are finished
I looked at four systems with publicly documented multi-year recoveries: Providence, Ascension, Tenet, and Community Health Systems (CHS). They differ in structure, market, and starting point.
They share one trait: none of them fixed the problem in a budget cycle.
Providence launched its restructuring in 2022, when its operating loss reached $1.7 billion. Its run of positive operating quarters began in the third quarter of 2025. Tenet's turnaround began in late 2017 and is still expanding margin in 2026.
Ascension is still slightly negative on operating margin. CHS reported a net loss in its latest quarter. Here is what each system did, what it cost, and what you can measure in your own organization.
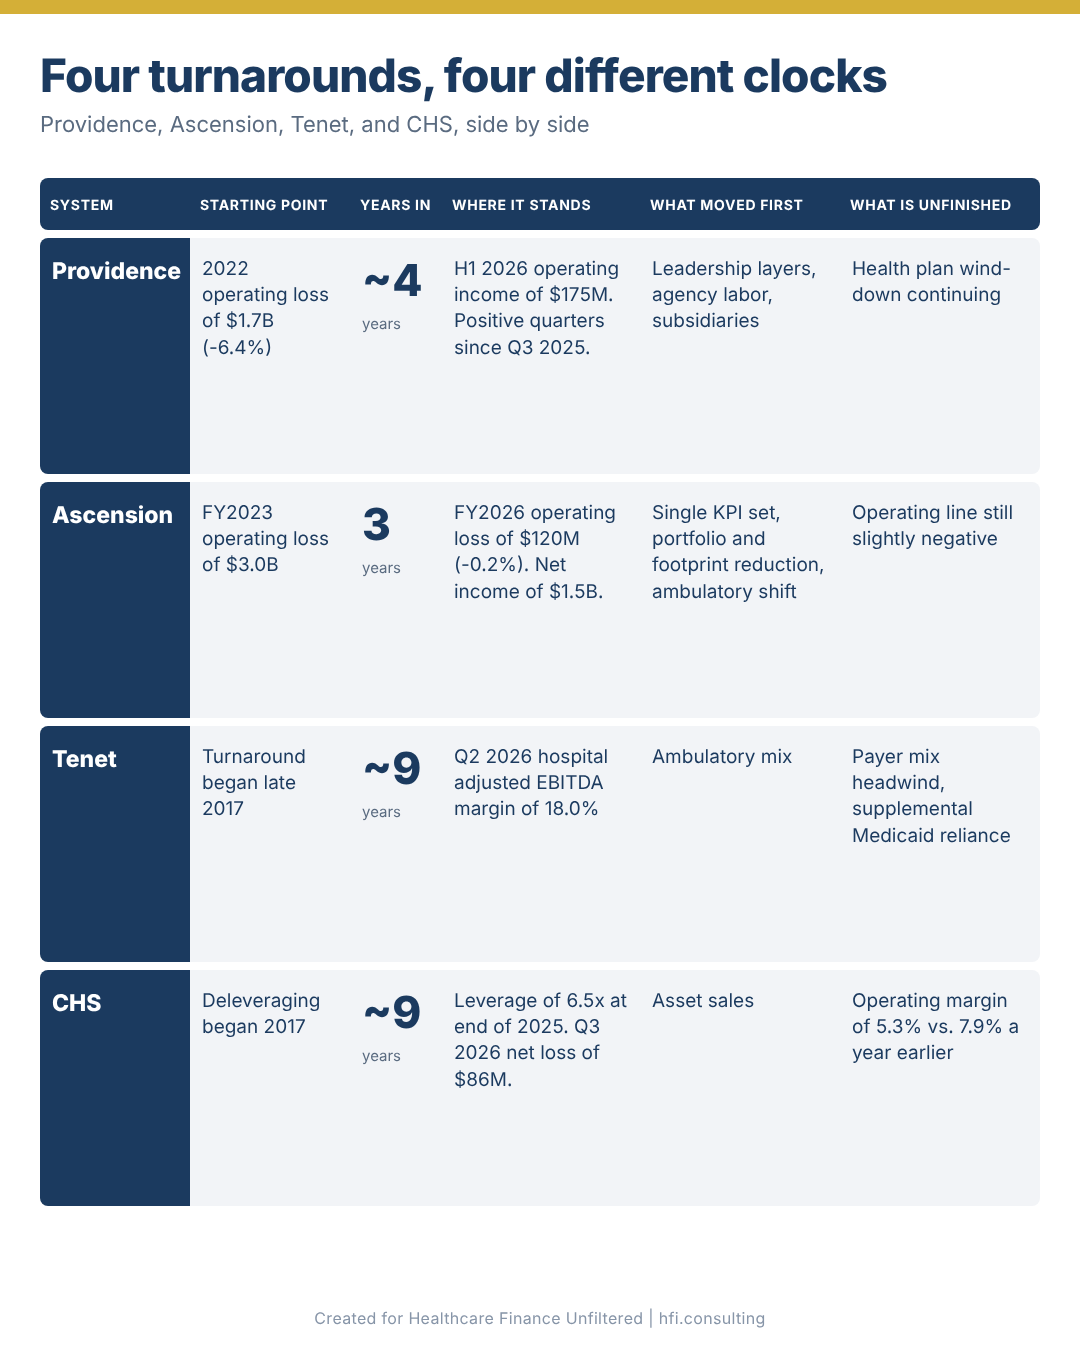
Comparison table of Providence, Ascension, Tenet, and CHS showing starting point, years in, current results, what moved first, and what remains
Providence: the restructuring costs show up before the savings do
Providence's 2024 operating loss was $644 million. That figure included $183 million in restructuring costs for asset rationalization and employee reductions.
Plan for that pattern. The cost of a turnaround reaches the income statement first, and the savings arrive in stages. I covered the formal restructuring side in my healthcare bankruptcy restructuring playbook.
What moved the line was a set of changes made at the same time, according to its CEO. Providence cut leadership layers, narrowed its core services, and reduced its reliance on agency labor. It also cut its subsidiaries and support corporations by about half, and it is winding down a health plan that lost more than $100 million in 2025.
By early 2025, Fitch reported that agency contract labor costs were down 70% from their 2022 peak. That is a line you can find in your own labor reports. In the first half of 2026, Providence reported operating income of $175 million, compared with a $225 million loss a year earlier.
Providence executives now describe the recent results as a cushion ahead of federal Medicaid changes that begin phasing in during 2027.
Ascension: the bottom line healed before the operating line did
Ascension reported $1.5 billion in net income for fiscal 2026. Its operating result was a $120 million loss. The gap includes nearly $2.1 billion in net investment returns.
That is a balance sheet story. It is not the same as fixing operating margin, which means cost per case, labor, and payer mix. Boards confuse the two more often than they should.
The operating line is moving. Losses went from $3.0 billion in fiscal 2023 to $1.8 billion in 2024, a year that included a ransomware attack. They then fell to $491 million in 2025 and $120 million in 2026.
Ascension says that excluding costs tied to its AmSurg acquisition, core operations turned positive in 2026. It also got smaller to get there. It ended the year with 91 hospitals, about 14,500 fewer full-time employees, and nearly 80,000 fewer discharges than a year earlier.
Its leaders describe a three-part operating model: growth, optimization and efficiency, and rate, which covers managed care and revenue cycle. They also built one set of KPIs because leadership had been spending more time arguing over competing data than acting on it. An internal audit found close to 1,000 initiatives flowing from the corporate office to the markets.
"The rest of it is love-to-haves and little projects." Sally Deitch, Ascension, on narrowing the list (Becker's Hospital Review)
I worked inside Ascension Florida's finance function from 2015 to 2019, managing productivity and other functions across seven facilities. Margins in Florida were very tight. We were rebuilding and repairing hospitals damaged by hurricanes, and ancillary services such as lab, radiology, and physical therapy were struggling.
Cost accounting was also on the move. It was centralized at the home office in St. Louis. Locally, we could still run reports to support service lines, but the managerial accounting work moved away from the facilities.
I am not arguing against centralization. Standard methods have real value. I am saying that when the people closest to a service line cannot explain its margin, the question "where are we losing money" takes longer to answer.
I wrote about the same failure pattern at the practice level in my piece on healthcare chart of accounts errors.
Tenet: nine years in, the margin still depends on the portfolio
Tenet's turnaround began in late 2017. In the second quarter of 2026, its hospital segment posted an 18.0% adjusted EBITDA margin, up from 15.6% a year earlier. Net debt was 2.33 times adjusted EBITDA.
Look at what produced the result. Its ambulatory business, USPI, delivered $542 million of the company's $1.304 billion in adjusted EBITDA, roughly 42%, at a 39.0% margin. The hospital figure also included $92 million of prior-year Medicaid supplemental revenue, compared with $70 million in the same quarter last year.
The lesson is not that hospitals cannot recover. It is that the company that exits a turnaround often looks different from the one that entered it. I made the case for that kind of portfolio logic in my piece on portfolio rationalization and growing up instead of out.
CHS: the balance sheet moved faster than the operating line
CHS is the unfinished case, and it is the most instructive one. It bought Health Management Associates in 2014 for $7.6 billion and briefly operated more than 200 hospitals.
A portfolio rationalization and deleveraging strategy began in 2017, and CHS's 2020 annual report described it as complete. By early 2026, CHS had sold 35% of its hospitals since 2019. In 2026 alone, it divested nine hospitals or interests in them for about $1.2 billion in net proceeds.
CHS reported $509 million in net income for 2025, against a $516 million loss in 2024. The company credited the swing mainly to net gains on sales of businesses.
The progress is real. Leverage fell from 7.9 times to 6.5 times during 2025, and CHS generated positive free cash flow of $150 million for the first time in several years. Moody's upgraded its rating to Caa1 in July, citing material deleveraging, and long-term debt was $9.55 billion at midyear, down from $10.38 billion at the end of 2025.
Then came the third quarter. Operating income fell to $146 million, a 5.3% margin, from 7.9% a year earlier. The net loss was $86 million.
Same-store revenue grew 3.8%, but reported revenue fell 11% because of divestitures.
"Payor mix and acuity did not develop as expected." Kevin Hammons, CHS CEO, on the third quarter (Becker's Hospital Review)
Asset sales can fix leverage. They do not fix cost per case or payer mix. CHS shows what happens when the balance sheet improves while the operating line is still open.
Florida readers will recognize part of the footprint. CHS sold its ShorePoint Health hospitals in Port Charlotte and Punta Gorda to AdventHealth in 2025.
If your board is asking for a 12-month answer to a multi-year problem, that gap is a reporting problem before it is a strategy problem. HFI Consulting helps finance teams build the cost accounting, chart of accounts structure, and variance reporting that show progress honestly at each stage. You can start the conversation at hfi.consulting.
A timeline you can put in front of your board: cash, then margin, then reinvestment
The sequence is the same across all four systems. Stabilize cash first, fix operating margin second, and reinvest third.
Always in that order. Skipping ahead is how organizations spend capital they cannot afford to lose.
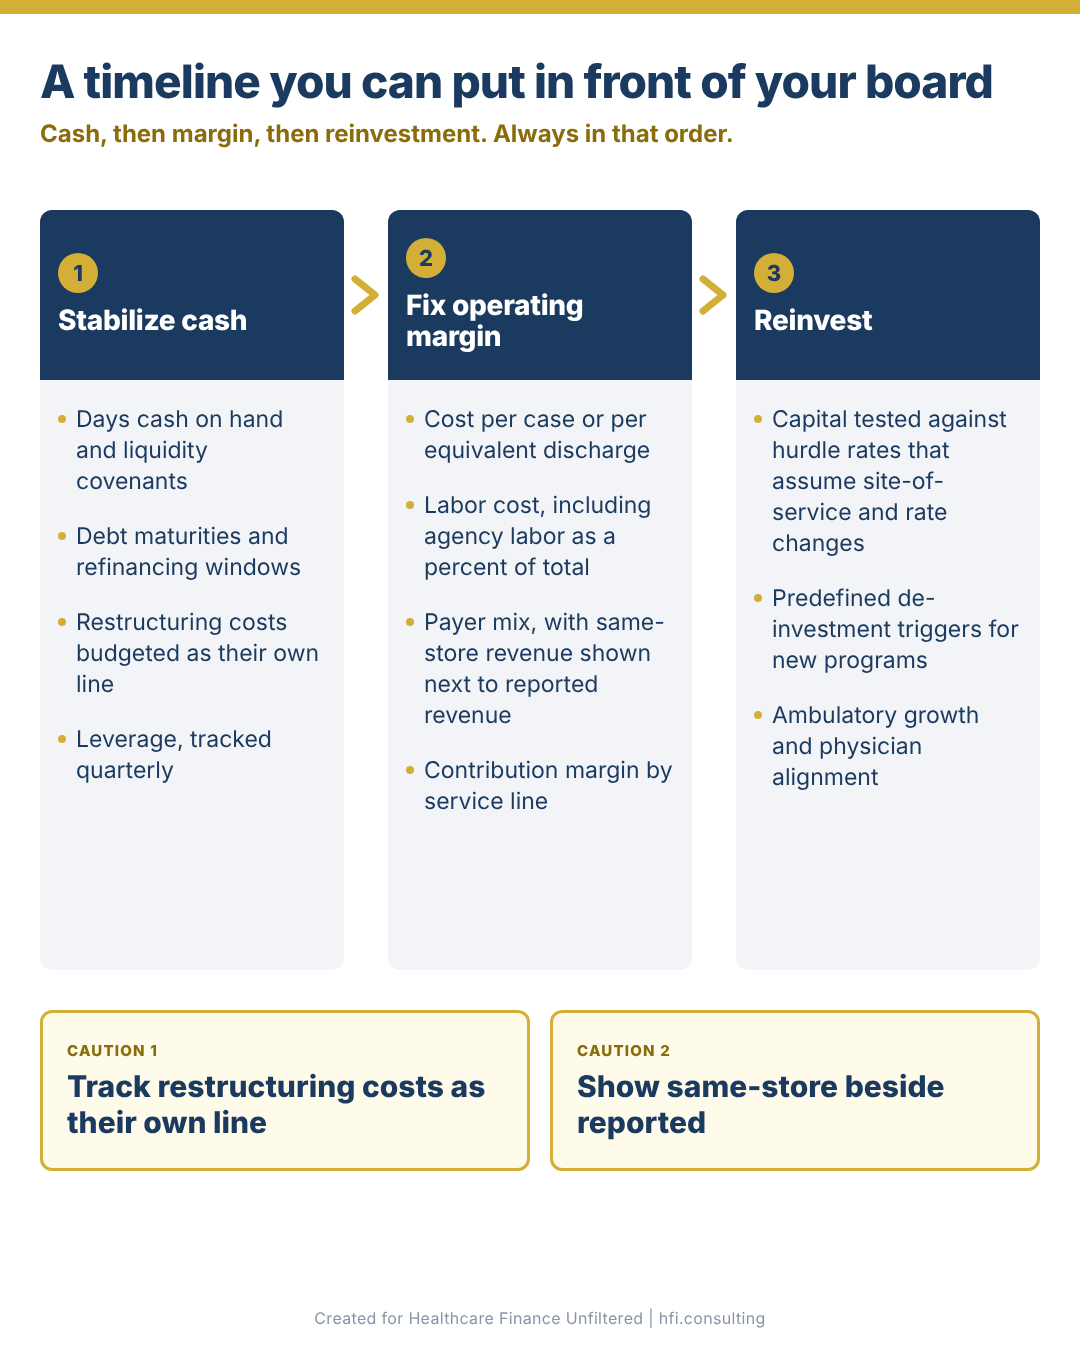
Three-stage turnaround flow: stabilize cash, fix operating margin, reinvest, with the metrics to track at each stage and two reporting cautions
Stage 1: Stabilize cash
Days cash on hand and liquidity covenants
Debt maturities and refinancing windows
Restructuring costs budgeted as their own line
Leverage, tracked quarterly
Stage 2: Fix operating margin
Cost per case or per equivalent discharge
Labor cost, including agency labor as a percent of total
Payer mix, with same-store revenue shown next to reported revenue
Contribution margin by service line
Stage 3: Reinvest
Capital tested against hurdle rates that assume site-of-service and rate changes
Predefined de-investment triggers for new programs
Ambulatory growth and physician alignment
Two cautions. First, track restructuring costs as their own line, or year two will look like failure. Second, show same-store results beside reported results, or divestitures will hide your real direction.
Stage 2 is where managerial accounting does the heavy lifting, and it is the core of what HFI focuses on. If you cannot show operating margin by service line, you cannot tell which stage you are actually in. I laid out the planning side of this in my finance and strategy alignment guide, including rolling capital allocation and de-investment triggers.
Here is a practical test for which stage you are in. Ask what happens if volume dips next quarter.
If the answer depends on a covenant waiver, you are still in Stage 1. If it depends on labor cost or payer mix, you are in Stage 2. If it depends on whether a capital project can wait, you have reached Stage 3.
Report each stage on its own cadence. Liquidity and covenant metrics belong in front of the board every month. Operating margin by service line fits a quarterly review.
Reinvestment decisions belong in the capital committee, with de-investment triggers written down before the money is spent.
What the other side of the table sees
From the payer side, a health system in a turnaround looks different at the contracting table than it does in a board deck. Payer finance teams ask a specific question. Will this rate increase stop the disruption, or will it fund ongoing losses?
Some payers run predictive models on claims history to answer it. Many also build contingency plans, securing capacity with competing regional systems in case talks fail. And they hold the line on utilization management rules, because those rules are their primary tool for managing cost trend while the system works to maximize billable volume.
That is not an attack on the system. It is how thin-margin payers protect themselves.
So bring your timeline to the table. A rate request tied to operating milestones is a stronger case than a rate request tied to need. Ascension credited larger commercial rate increases from recent negotiations as part of its improvement, but rate is one leg of a three-part model, not the whole plan.
Plan as if utilization management rules stay where they are. Payer-side readers should note that the logic runs in reverse. A provider that can show its stages and milestones is easier to contract with than one that can only show distress.
Plan for the long version
The honest turnaround message is uncomfortable.
It takes years. It costs money before it saves money. It rarely ends cleanly.
It is also the message these four systems support. Four different clocks, and no quick wins among them. Give your board the long version, and give them the numbers that prove you are moving.
If you want a second set of eyes on your turnaround timeline, budget structure, or cost accounting, reach out at hfi.consulting. I work with CFOs and senior finance leaders on managerial accounting, chart of accounts design, budgeting, and variance analysis, from both the payer and provider side.
Summary graphic reading Stabilize cash, fix operating margin, reinvest, in that order
P.S. Which stage is your organization in right now: stabilizing cash, fixing operating margin, or reinvesting? Reply and tell me. I read every response.
