
Your Hospital Lab Is Harder to Value Than You Think. That Is Exactly Why You Need to Understand It.
Lab cost accounting is among the most complex in health system finance. Here is what the numbers actually tell you about margin, data, and patient volume.
Your hospital laboratory is probably on your cost report as a cost center. That classification is not wrong. Lab cost accounting is genuinely difficult, fixed overhead is substantial, and separating inpatient costs from ambulatory contributions is one of the harder analytical problems in health system finance. But treating the lab as purely a cost center, without understanding what it generates in margin and in data value for the broader care ecosystem, means you are making strategic decisions with an incomplete picture.
The commercial lab industry understands that picture very well. It is worth understanding it yourself.
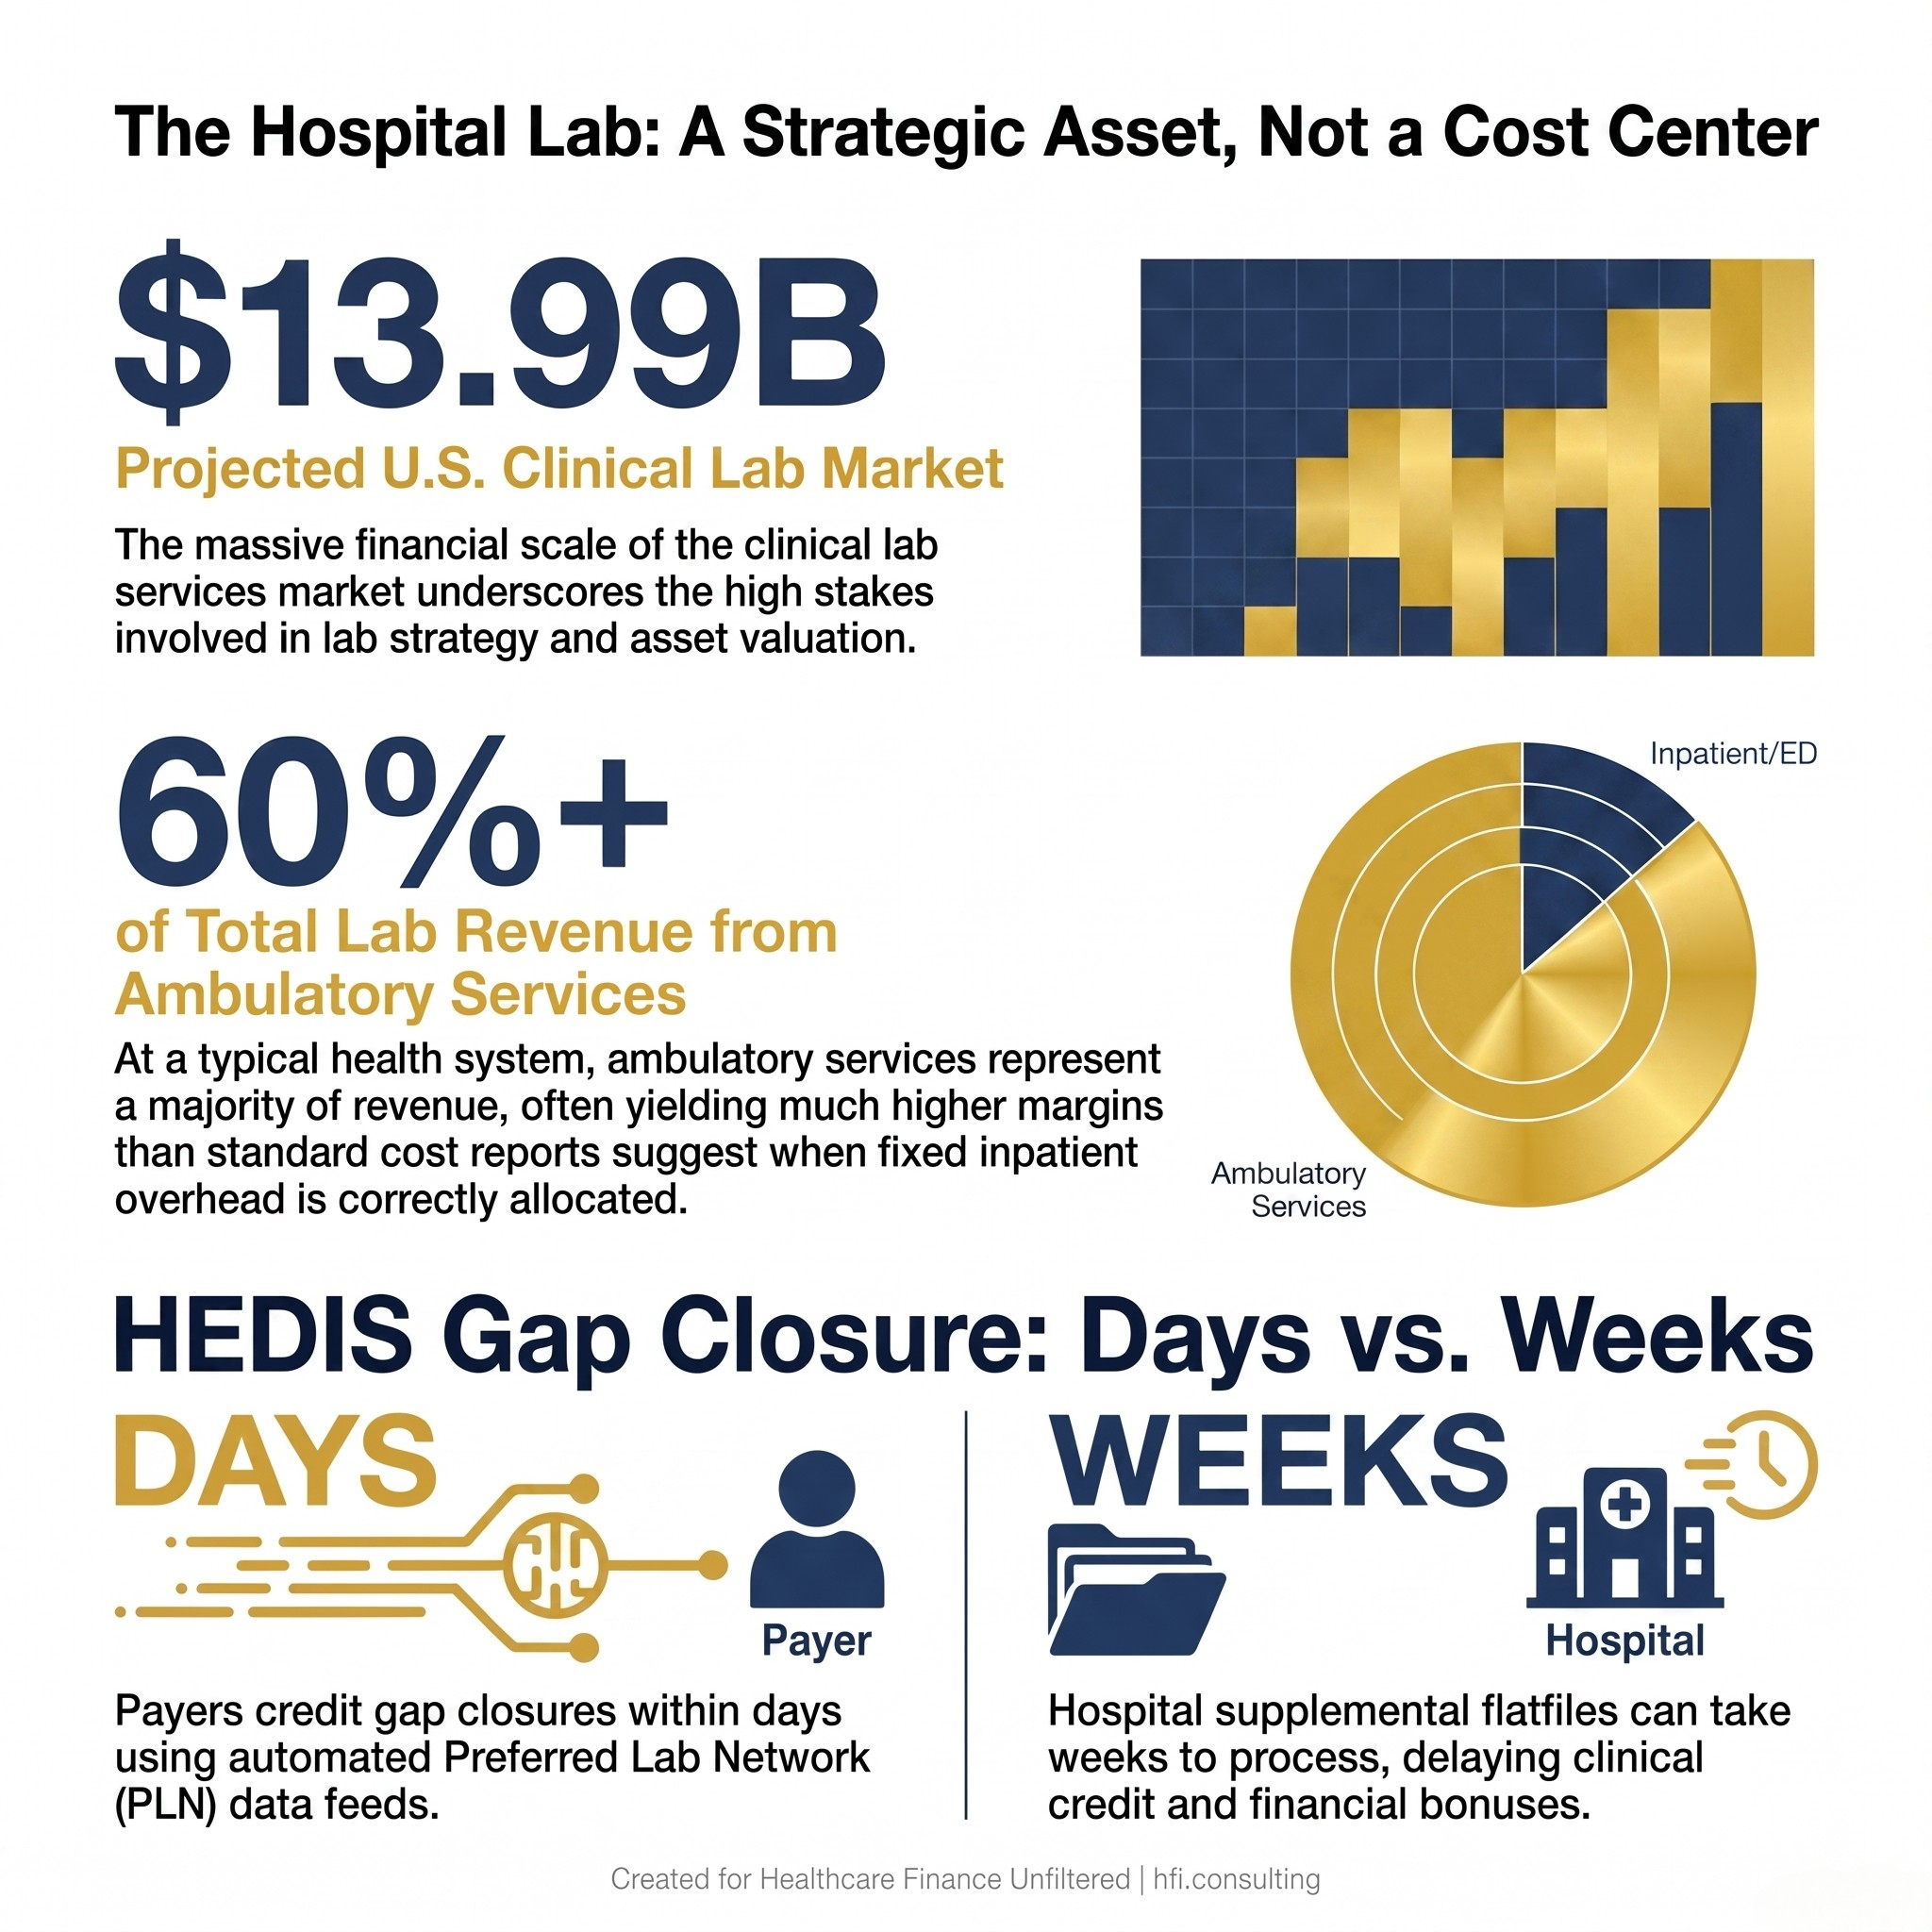
Three-stat card showing U.S. lab market size, ambulatory share of lab revenue, and payer data pipeline timing gap
Why Lab Cost Accounting Is So Hard to Get Right
The clinical laboratory sits at the intersection of two completely different service models running inside the same four walls. The first is inpatient and emergency department stat testing, which is non-negotiable. Your ED cannot function without rapid turnaround on metabolic panels, troponins, and blood cultures. Your ICU depends on it. This testing requires staffing and equipment at a fixed baseline regardless of volume, and that baseline is substantial.
The second service model is ambulatory and outpatient testing, which operates on a different economic logic entirely. When a physician orders a lipid panel on an outpatient basis, or a patient comes through your draw center for a routine A1c, that test runs on infrastructure you have already paid for. The marginal cost of that ambulatory draw is far lower than the average cost per test that most cost reports show.
The problem is that most health system cost reports do not separate these two service models. Average cost per test across the entire laboratory spreads fixed inpatient overhead across ambulatory volume, making the outpatient testing business look far less profitable than it actually is.
ARUP Healthcare Advisory Services modeled this at a hypothetical $1.5 billion health system. Ambulatory lab services represented 64% of total lab revenue but only 32% of total lab expense when fixed costs were correctly allocated. The resulting net income from ambulatory services was $39.5 million. When fixed costs were inappropriately averaged across all testing, that same ambulatory business appeared to generate $18.5 million. A $21 million difference on a single line item.
That gap is not a rounding error. For a system operating at thin margins, it is the difference between understanding your lab as a strategic asset and treating it as an overhead burden you would rather someone else manage.
The Cost Report Does Not Capture the Data Value
Here is what makes lab strategy genuinely complicated for both provider and payer finance leaders: the financial value of a hospital lab is not fully visible on either side's income statement.
From the provider side, the cost report captures revenue, expense, and some margin contribution. What it does not capture is the value of the data the lab generates. Every test result your lab produces is a clinical data point that flows into care management workflows, quality reporting systems, and payer documentation for gap closure. That data has real financial value. The question is who captures it.
From the payer side, the answer to that question depends entirely on where the member gets their blood drawn.
When a member uses a Preferred Lab Network provider, Quest or Labcorp sends results to the payer through an automated daily data pipeline. The results map directly into the payer's care management systems and HEDIS reporting infrastructure. A completed A1c or lipid panel credits toward gap closure within days. That pipeline is clean, consistent, and operationally low-cost for the payer to maintain.
When a member uses a hospital-based ambulatory lab instead, the payer does not receive a live data feed. The payer has to request supplemental data from the hospital, typically in a flatfile format delivered monthly or quarterly. That file requires cleaning, formatting, and manual reconciliation before any care gap credit can be applied. The clinical event may have happened weeks ago. The credit arrives late, if it arrives at all.
From my time in payer operations, flatfile reconciliation is one of the most consistently underestimated processes on the payer side. The labor cost is real. The error rate is higher than a live pipeline. And the timing gap means that care management teams are working from information that does not reflect what has already happened in the provider's system.
This dynamic shapes payer benefit design in ways that directly affect your ambulatory lab volume. Steering members toward PLN providers through lower cost-sharing is not arbitrary. It is a data pipeline decision dressed up as a benefits decision. The payer gets cleaner data faster, which improves their HEDIS scores and Star ratings, which has real dollar value in bonus payments and plan performance.
Understanding this mechanism matters for provider CFOs because it explains a volume dynamic that often looks like price competition but is actually a data infrastructure gap. Your ambulatory lab may be losing steerable volume not because your price is wrong, but because your data pipeline is not set up to deliver what payers need on their timeline.
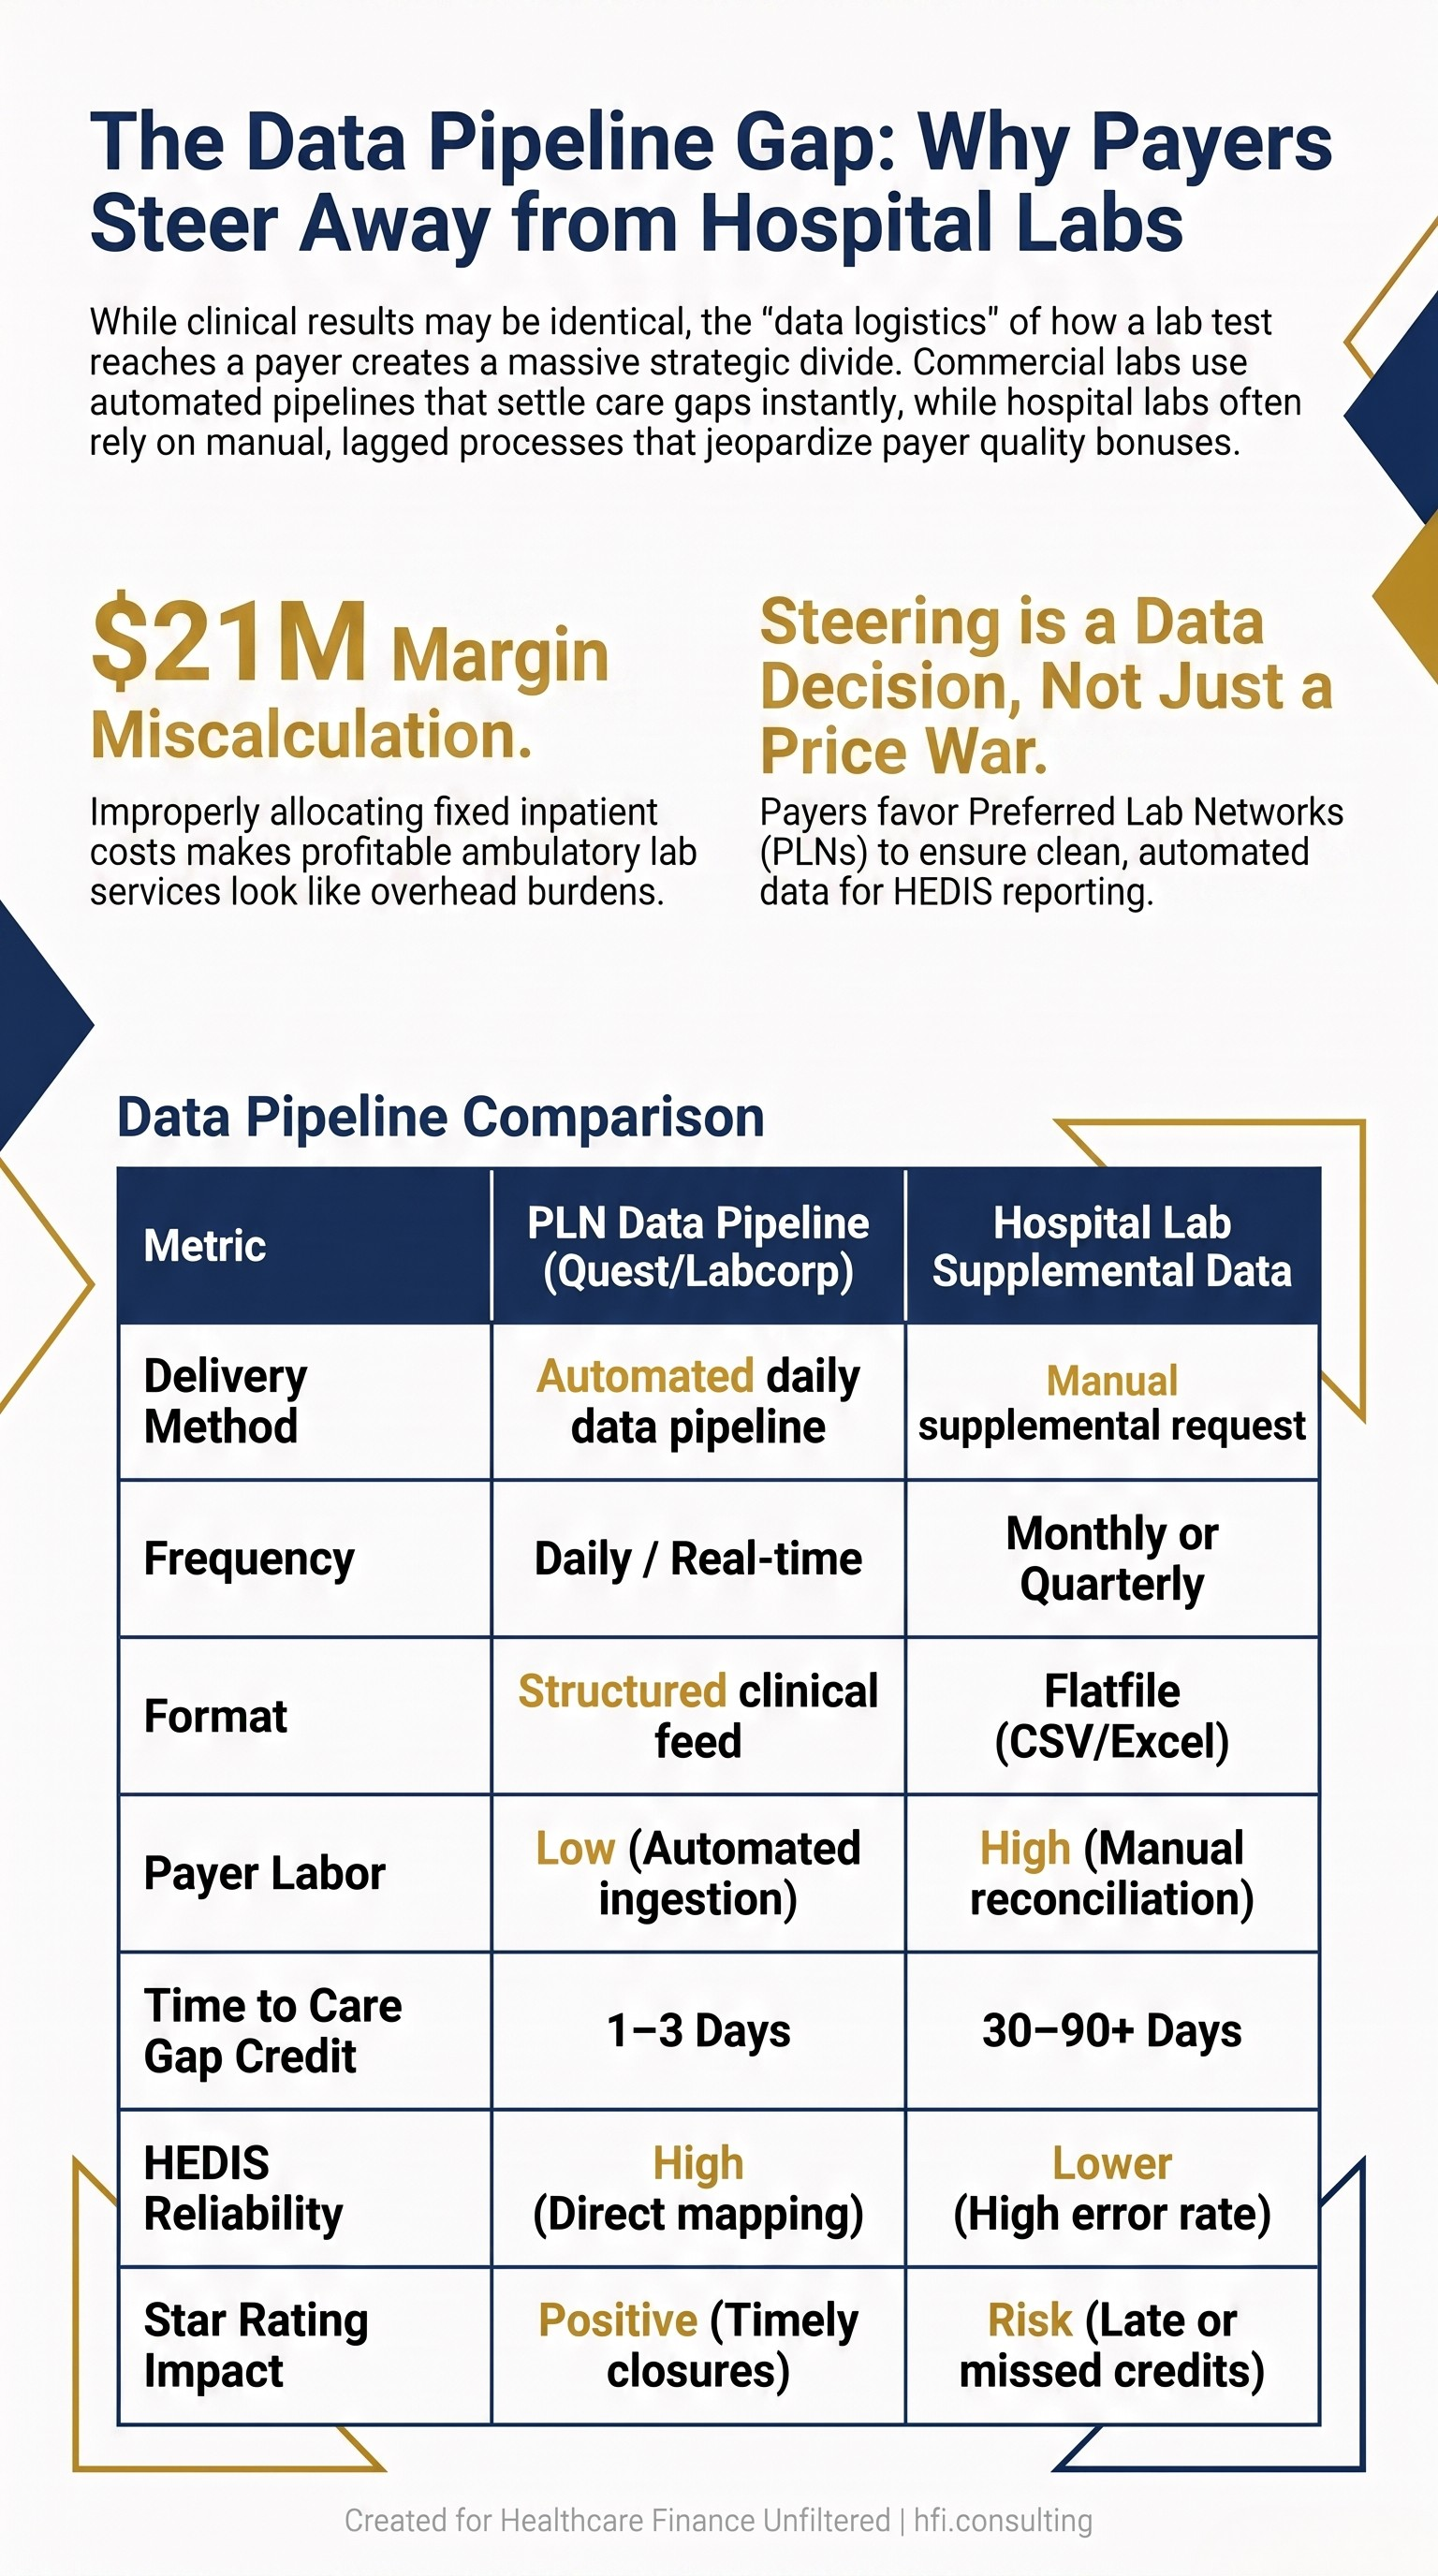
Comparison table showing data pipeline differences between PLN commercial lab feeds and hospital lab supplemental flatfiles for payer care gap closure
The Patient Experience Problem Is a Finance Problem
The other piece of the lab volume story that does not appear on a cost report is patient experience. And right now, patient experience at commercial lab Patient Service Centers is a serious operational liability for the commercial lab industry.
Labcorp and Quest have spent years optimizing their PSC networks for throughput efficiency. The result is a low per-test cost structure that is genuinely impressive at scale. It is also a patient experience that has deteriorated to the point where three-hour waits, often while fasting, are common at high-volume locations.
That wait time is not just a satisfaction problem. A patient who abandons a lab appointment because the wait is too long has not closed their care gap. Their A1c is not getting drawn. Their lipid panel is not in the system. The payer does not get that data. The provider does not get credit for the visit. The patient's chronic condition goes unmonitored for another quarter.
Hospital ambulatory labs are winning on this dimension right now. A patient who walks into a hospital outpatient pavilion or a health system draw center can often be in and out in 15 minutes. Those labs are staffed to handle baseline inpatient surges, not optimized for commercial throughput. The patient experience benefit is a structural byproduct of a staffing model that was never designed around commercial efficiency targets.
For hospital CFOs, this is a volume opportunity that the cost report does not surface. The incremental margin on ambulatory draw volume that runs on already-paid fixed infrastructure is strong. The question is whether your organization is positioned to capture it.
At Ascension, I watched health systems with well-run ambulatory draw networks steadily absorb volume from commercial labs in the same market, particularly among older patients and those with chronic conditions who were willing to pay a modest facility fee for a shorter wait and a more navigable experience. The volume shift was gradual, but it was consistent.
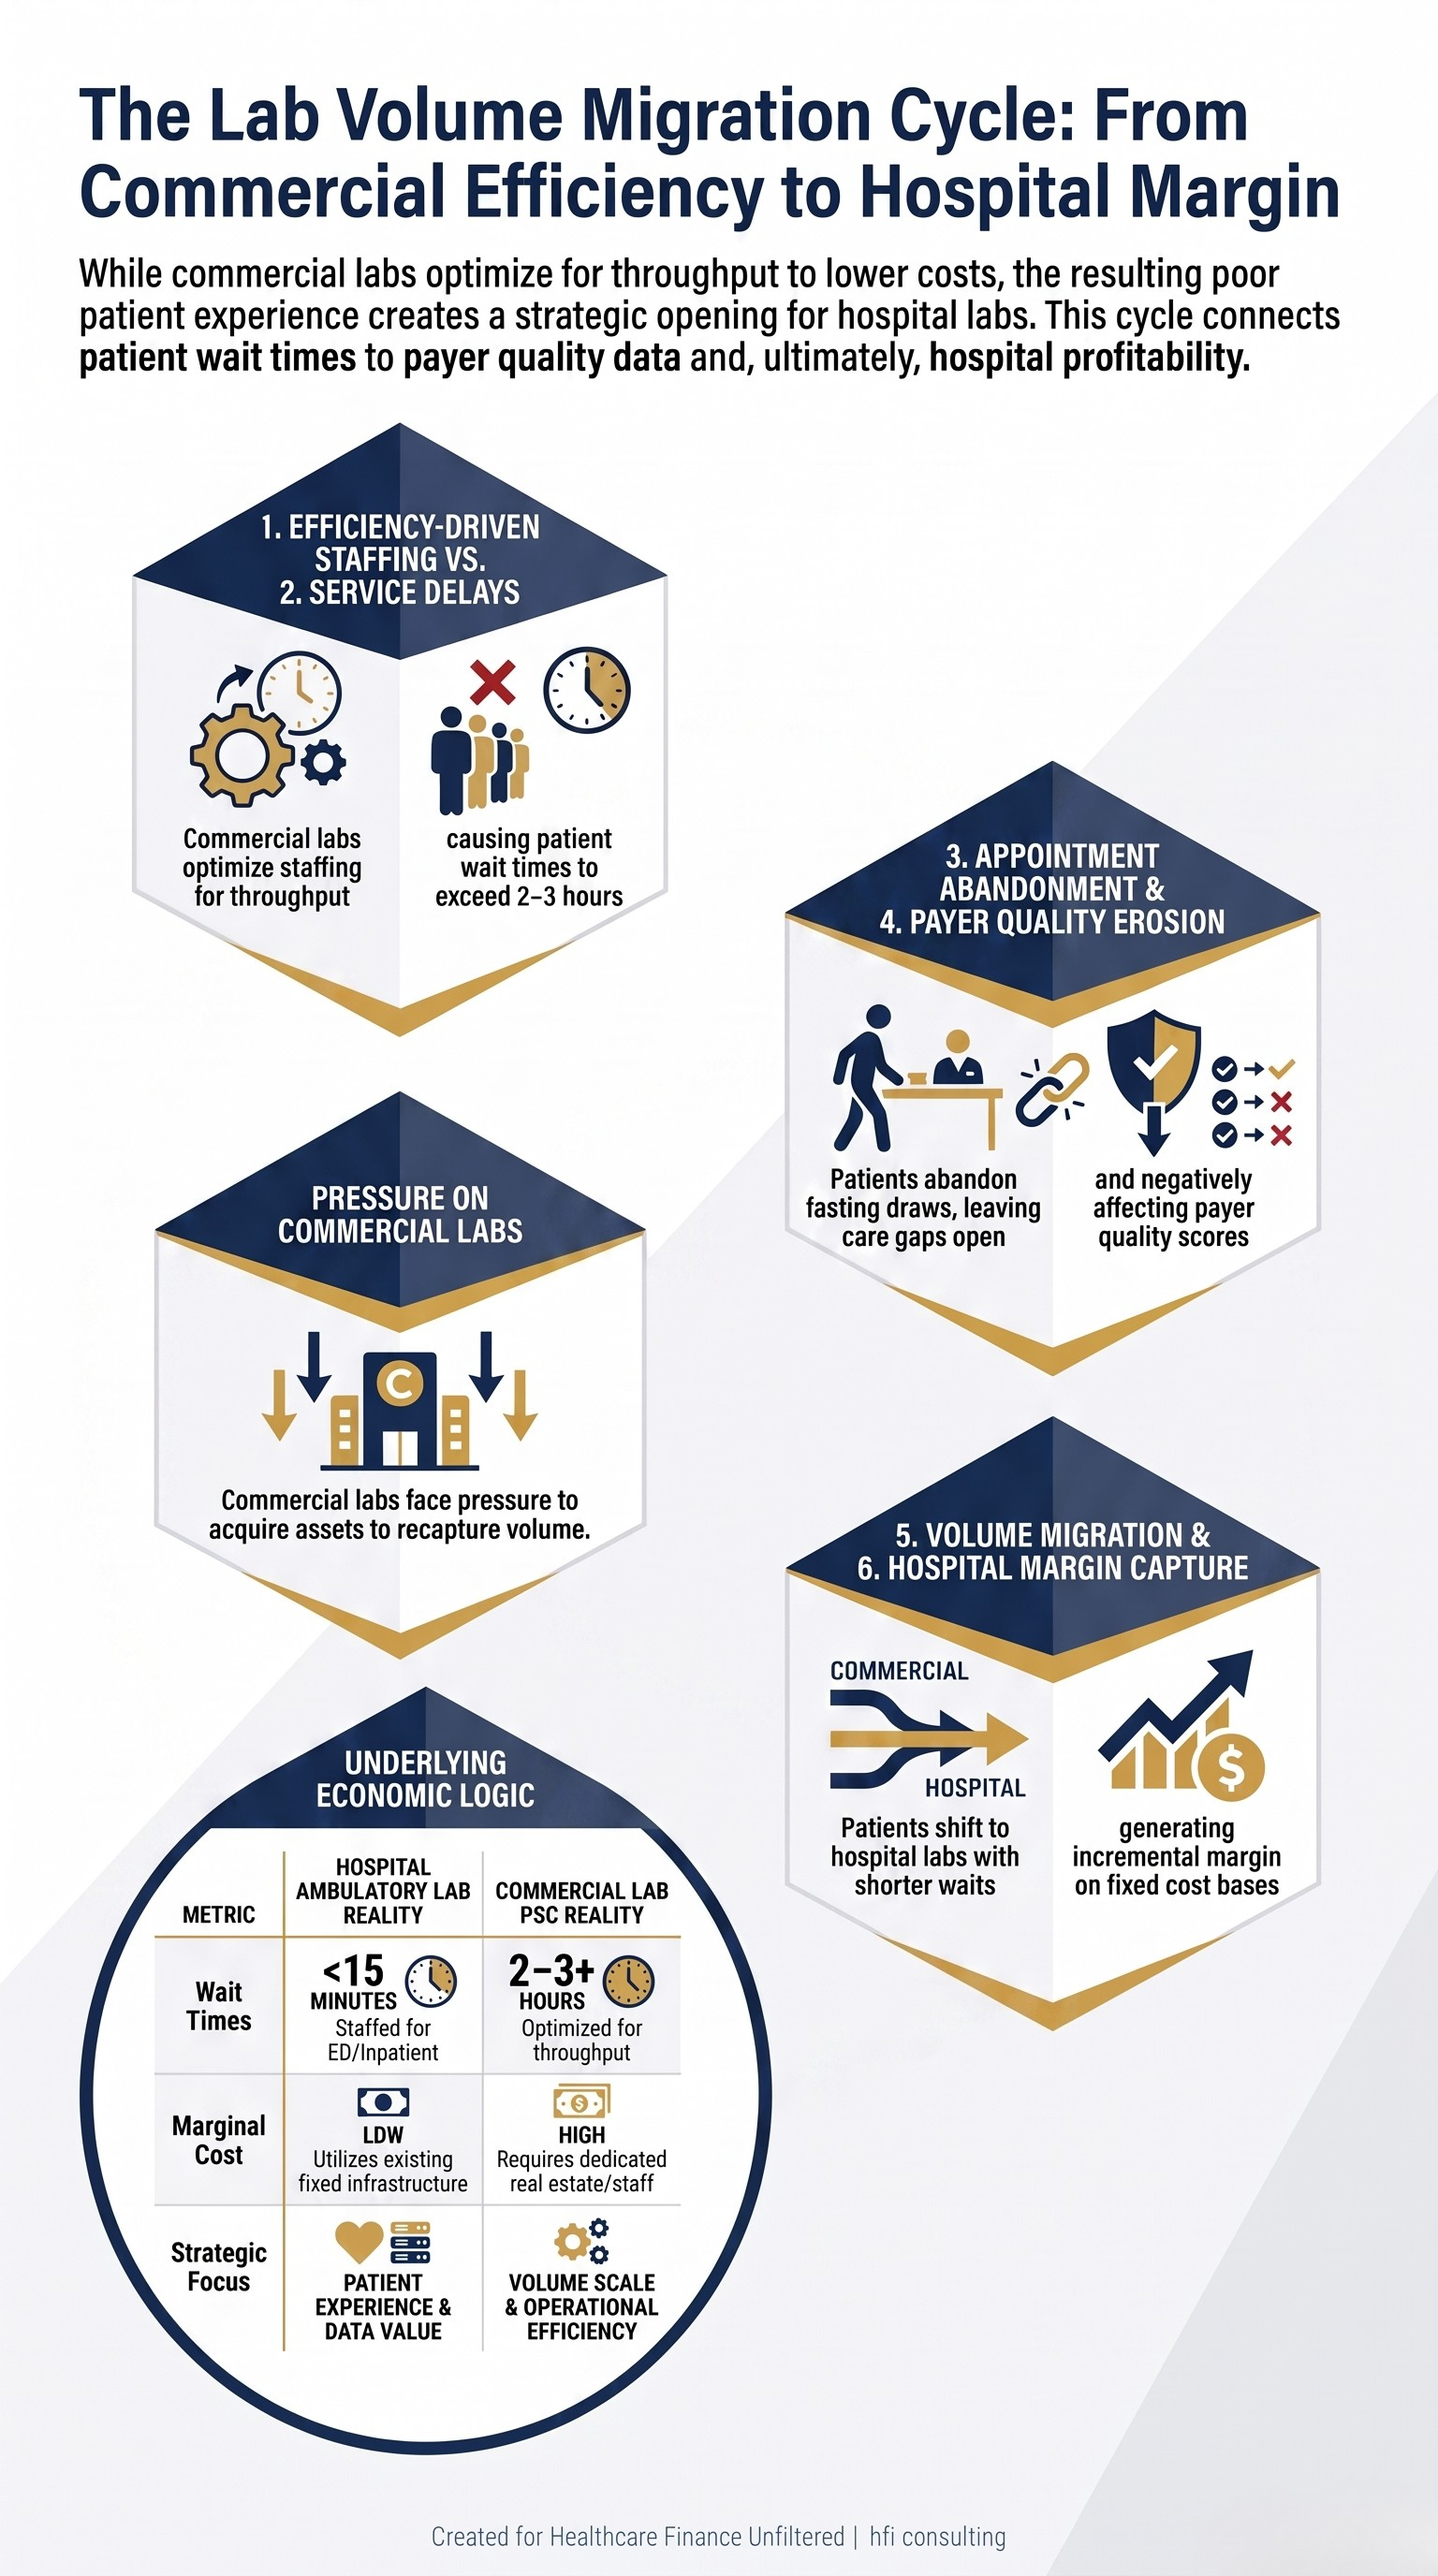
Circular diagram showing how commercial lab PSC understaffing drives patient migration to hospital ambulatory labs and affects payer quality metrics
What the M&A Activity Actually Signals
Commercial lab M&A is worth acknowledging briefly because it is active and it affects the market context hospital CFOs are operating in. Labcorp has acquired ambulatory lab assets from several health systems in recent years. Quest finalized a joint venture with Corewell Health covering 21 hospitals in January 2026.
These deals are not primarily about acquiring equipment or real estate. They are about acquiring ambulatory volume and the data pipeline that comes with it. When a commercial lab takes over a health system's ambulatory draw network, the data from those draws flows into the commercial lab's PLN infrastructure. The payer gets a cleaner feed. The health system gets capital and a management services relationship. The commercial lab gets the volume and the data.
Whether that trade makes sense for any specific health system depends on the contribution margin analysis described earlier. If your organization has not modeled ambulatory lab profitability with proper fixed cost allocation, you do not have the right number for that conversation.
The CFO Action Framework
The lab strategy question for most provider finance leaders is not whether to sell or partner. It is whether they have the analytical foundation to make any of these decisions well. That foundation has two components.
Contribution margin visibility. Your cost accounting system needs to produce an ambulatory lab contribution margin report that separates fixed inpatient overhead from variable ambulatory costs. If that report does not exist, build it before any other lab strategy conversation happens. The number it produces will change how you think about every other decision in this section.
Data pipeline audit. Work with your managed care contracting team and your health information management team to understand what happens to your lab data after the test runs. Which payers receive results through an automated feed? Which payers are receiving manual flatfiles? Which payers are not receiving supplemental data at all? The answers to these questions have direct implications for your Star rating exposure on value-based contracts and for your ability to demonstrate care gap closure on your MA patient population.
If your payer contracts include quality bonuses tied to HEDIS measures that depend on lab results, and your lab data is arriving at the payer weeks late through a flatfile process, you may be losing bonus dollars for clinical work that has already been done. That is a revenue cycle problem, not a lab problem. But it starts with understanding the lab data pipeline.
For payer CFOs reading this, the parallel question is whether your flatfile reconciliation process has been formally costed and whether that cost has been weighed against the benefit design levers that would reduce your supplemental data burden. The PLN steering incentive is well understood. The operational cost of the alternative is less often modeled explicitly.
If your organization is working through a lab strategy question, a contribution margin analysis, or a payer data pipeline audit, HFI Consulting works with provider and payer finance teams on exactly this type of decision framework.
For a broader look at how ancillary service line contribution margin works across the health system, see Contribution Margin Integrity: The CFO Framework for Catching What Your Dashboard Is Missing.
PAMA and the Reimbursement Context
One external factor worth building into your lab strategy model: PAMA. Congress has delayed Medicare payment cuts of up to 15% on nearly 800 laboratory tests, which has provided temporary revenue stability for the commercial lab industry. The RESULTS Act, currently in discussion, would permanently cap annual Medicare lab payment cuts at 5%.
The PAMA delay matters for hospital CFOs because reimbursement stability is a planning window, not a permanent condition. The time to build accurate contribution margin data and model your ambulatory lab options is during a period of relative stability, not under pressure when cuts arrive.
For context on how reimbursement pressure compounds across the revenue cycle, see The Denial Loop Is Breaking Healthcare: What Both Sides Are Paying and What Has to Change.
What to Do Before Budget Season
The lab is not going to get simpler. Reimbursement pressure is real. Commercial lab competition for ambulatory volume is real. Payer data infrastructure requirements are only becoming more specific as Star ratings and HEDIS measures become more consequential for value-based contract performance.
The CFOs who navigate this well are the ones who stop treating the lab as a black box on the cost report and start understanding what it actually generates: margin on ambulatory volume, data that payers need to close care gaps, and patient experience that is quietly winning volume back from commercial competitors in markets where the PSC wait time problem has gotten bad enough.
None of that shows up cleanly in a standard cost report. But all of it belongs in your lab strategy conversation.
The starting point is the contribution margin model. Build it, allocate fixed costs correctly, and then have the conversation about what your lab is actually worth.
Your lab strategy is worth a closer look before someone else decides it for you. If HFI Consulting can help with the analysis, visit hfi.consulting to connect.
The clinical laboratory has always been operationally complex. The finance leaders who understand that complexity, rather than outsourcing the decision to whoever shows up with an offer, are the ones who will capture the margin and the data value the lab was generating all along.
P.S. How does your organization currently track ambulatory lab contribution margin separately from inpatient lab costs? Is that a number you can pull today, or is it buried in your overall department report? Hit reply and tell me where your cost accounting stands on this one.
