
No Margin, No Mission: What the Hospital Pricing Report Means for Health System CFOs
A new Families USA analysis says large systems charge 3x Medicare. Here is the CFO-level breakdown of what that number means for your budget and planning horizon.
The Families USA report released May 7 landed exactly as these reports always do: with a headline that makes the morning news cycle and leaves finance leaders spending the next 48 hours fielding calls from board members. The finding that the 15 largest hospital systems charged an average of 282% of the Medicare rate, generating over $22 million in net income per hospital annually, framed the healthcare finance function as the problem.
The AHA responded the following day, calling the report "long on rhetoric and short on reality" and reiterating what anyone who has sat in a hospital CFO's chair already knows: hospitals are largely price takers, not price setters. Both statements contain real truth. Neither tells the full story your board actually needs.
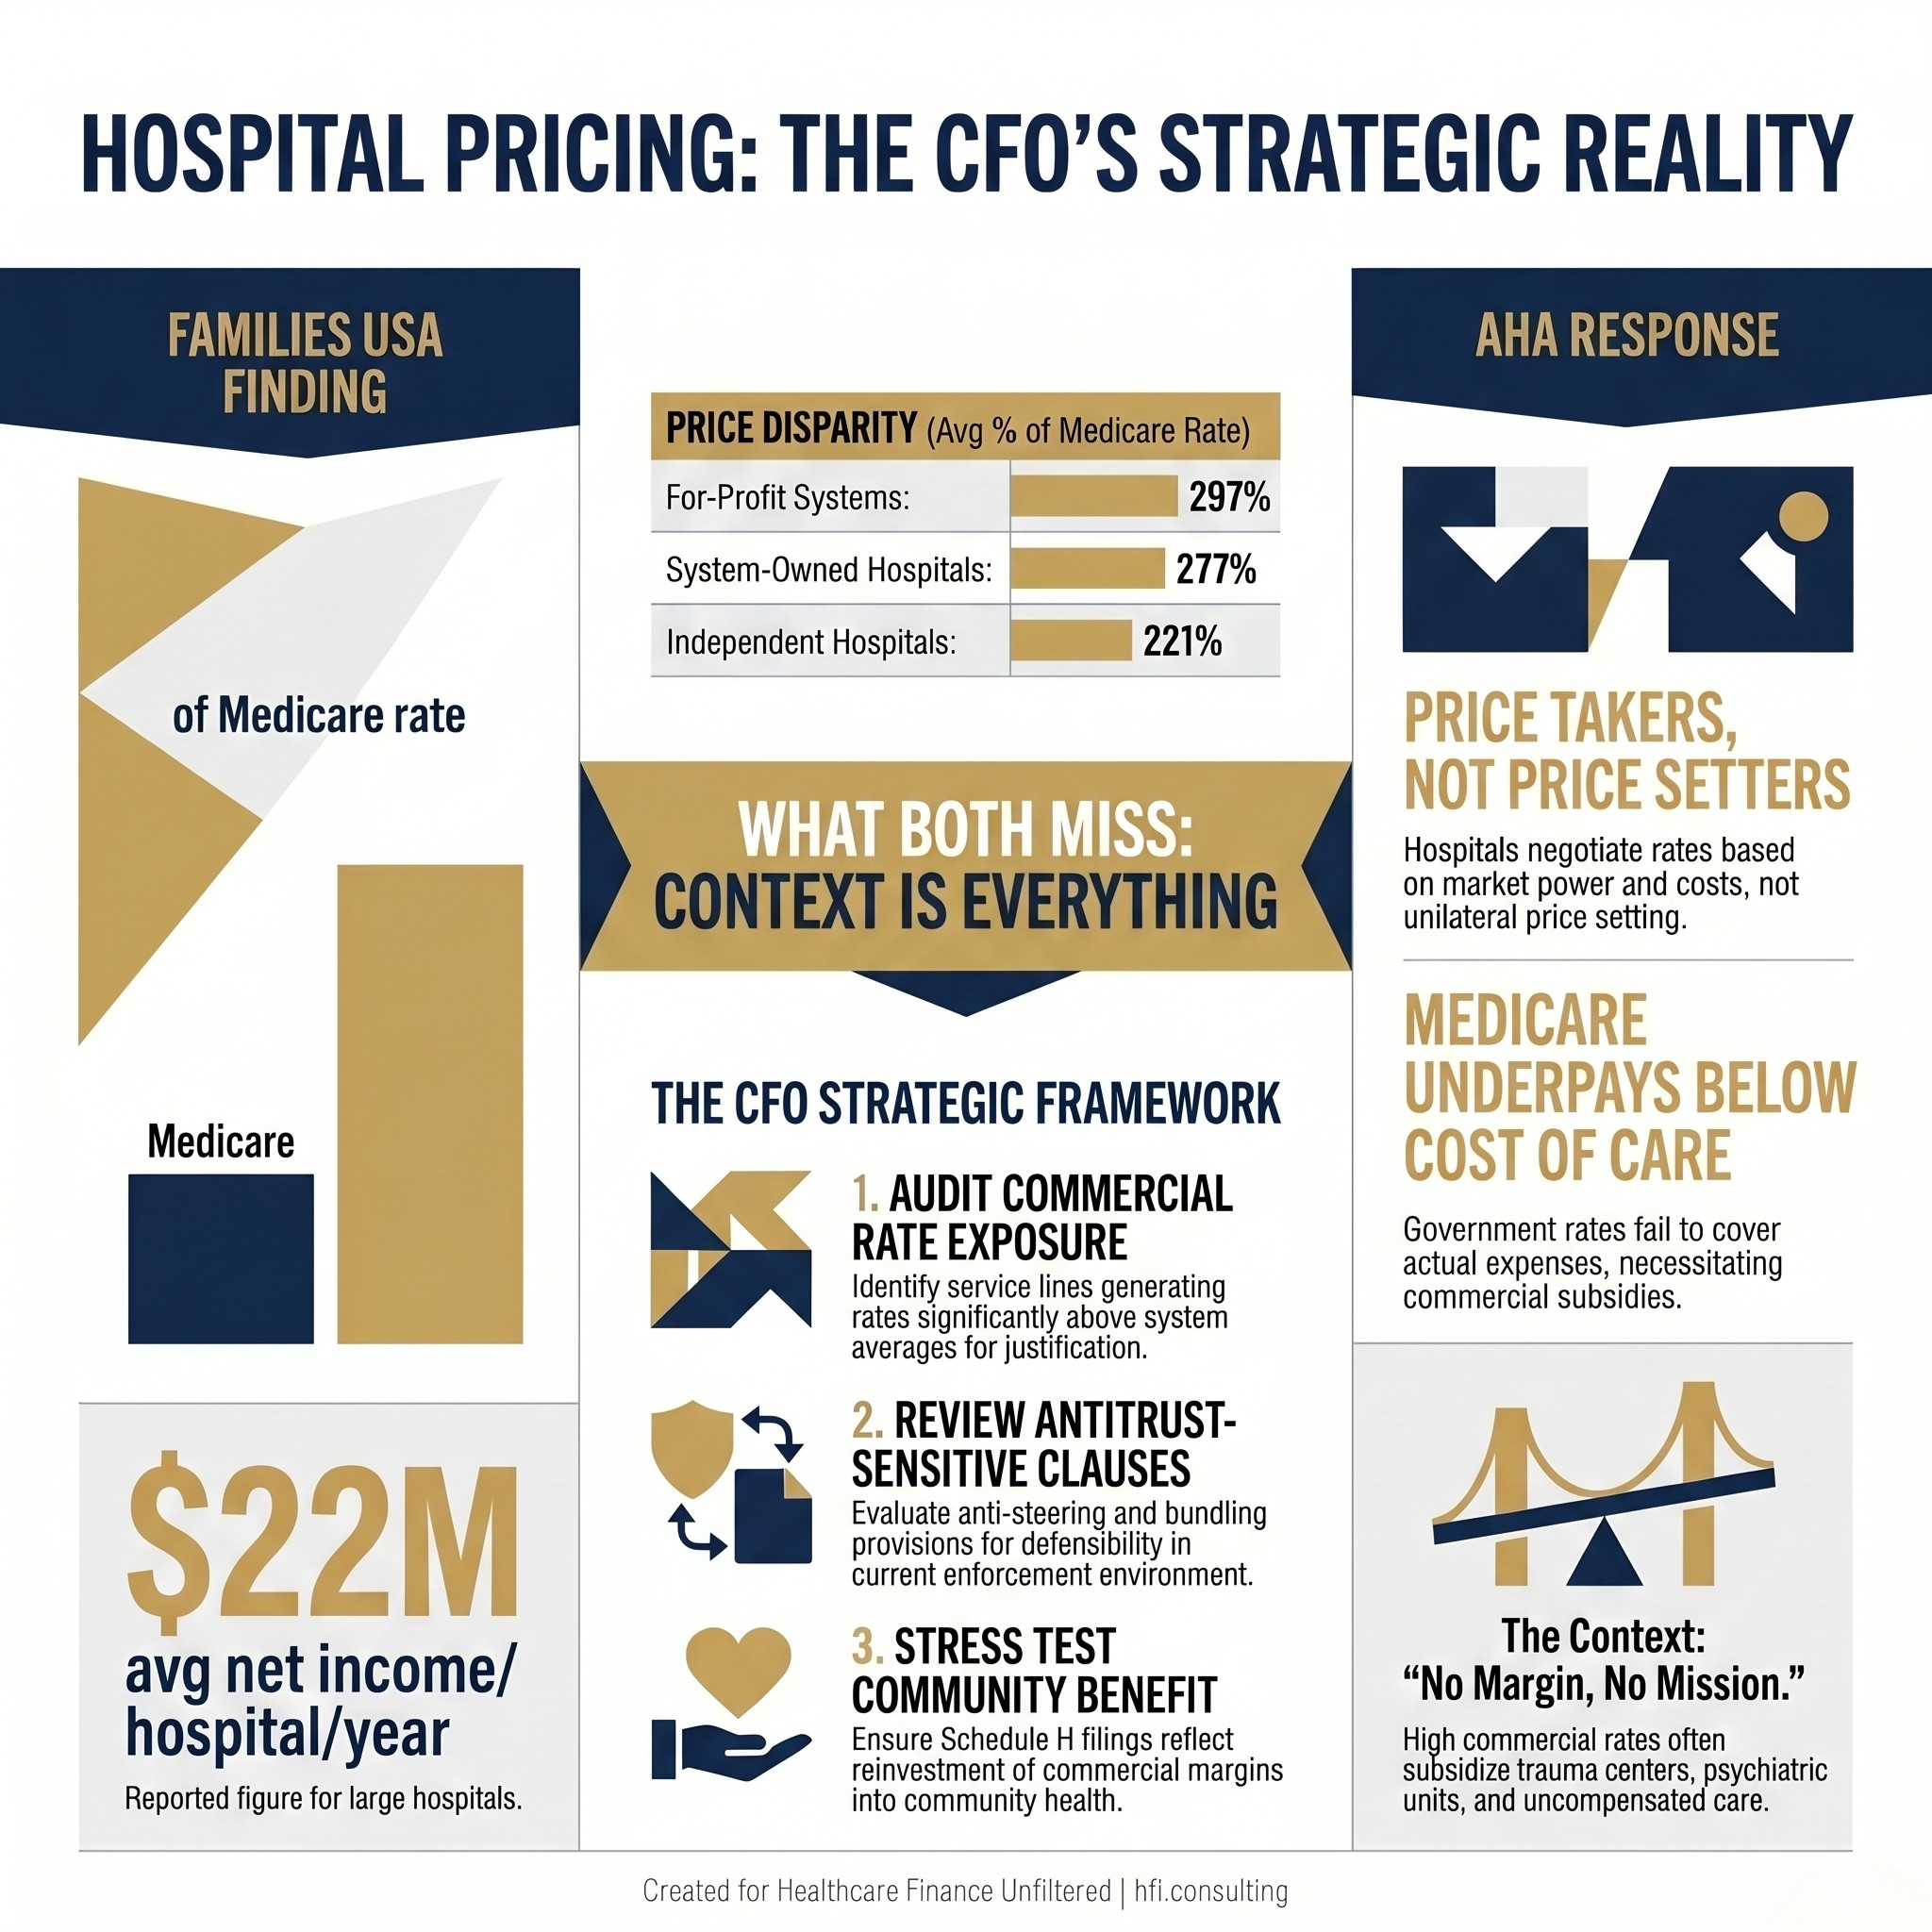
Side-by-side comparison of Families USA hospital pricing findings versus AHA response framing for healthcare CFO context
The Benchmark Problem at the Center of This Debate
The Families USA analysis uses Medicare payment rates as the only national standard for fair hospital pricing. That choice is methodologically defensible and operationally misleading at the same time.
Medicare rates are set by Congress and CMS, not by market forces. In most service lines, Medicare pays below the actual cost of delivering care. Medicaid rates are lower still. When a report uses Medicare as the floor for "reasonable" commercial pricing, it is comparing negotiated market rates to a government-set rate that was never designed to reflect full cost recovery.
This does not make commercial pricing above Medicare automatically fair. What it means is that the 282% figure tells you something real about market concentration without telling you anything useful about whether those prices are sustainable, appropriate, or extractive relative to actual cost structure. For CFOs preparing board materials or responding to media inquiries, that distinction matters.
A note on the data: the Families USA analysis covers 2018 through 2023 and includes COVID-era years when hospital finances were abnormal in both directions. Treat the aggregate numbers as directional indicators rather than current financial benchmarks.
Why System-Owned Hospitals Charge More: The Structural Answer
The report notes that system-owned hospitals charged commercial insurers an average of 277% of Medicare, compared to 221% for independent hospitals. The AHA would call this a payer mix story. The Families USA researchers would call it consolidation leverage. Both interpretations are present in the data simultaneously.
System-owned hospitals typically carry heavier payer mix burdens. They run trauma centers, level III NICUs, psychiatric units, and disproportionate share hospital designations. These service lines generate significant Medicaid and uncompensated care volume. The commercial rate structure that results, whether negotiated through leverage or through structural necessity, partly reflects that cost reality.
In my work across seven hospitals at Ascension, the facilities carrying the highest Medicare and Medicaid payer mix were the same facilities with the highest commercial rates. The math was not about extracting margin from commercially insured patients. It was about ensuring the system as a whole could absorb losses that no reimbursement program was designed to fully cover.
The report notes that system-owned hospitals charged commercial insurers an average of 277% of Medicare, compared to 221% for independent hospitals. The AHA would call this a payer mix story. The Families USA researchers would call it consolidation leverage. Both interpretations are present in the data simultaneously.
System-owned hospitals typically carry heavier payer mix burdens. They run trauma centers, level III NICUs, psychiatric units, and disproportionate share hospital designations. These service lines generate significant Medicaid and uncompensated care volume. The commercial rate structure that results, whether negotiated through leverage or through structural necessity, partly reflects that cost reality.
In my work across seven hospitals at Ascension, the facilities carrying the highest Medicare and Medicaid payer mix were the same facilities with the highest commercial rates. The math was not about extracting margin from commercially insured patients. It was about ensuring the system as a whole could absorb losses that no reimbursement program was designed to fully cover.
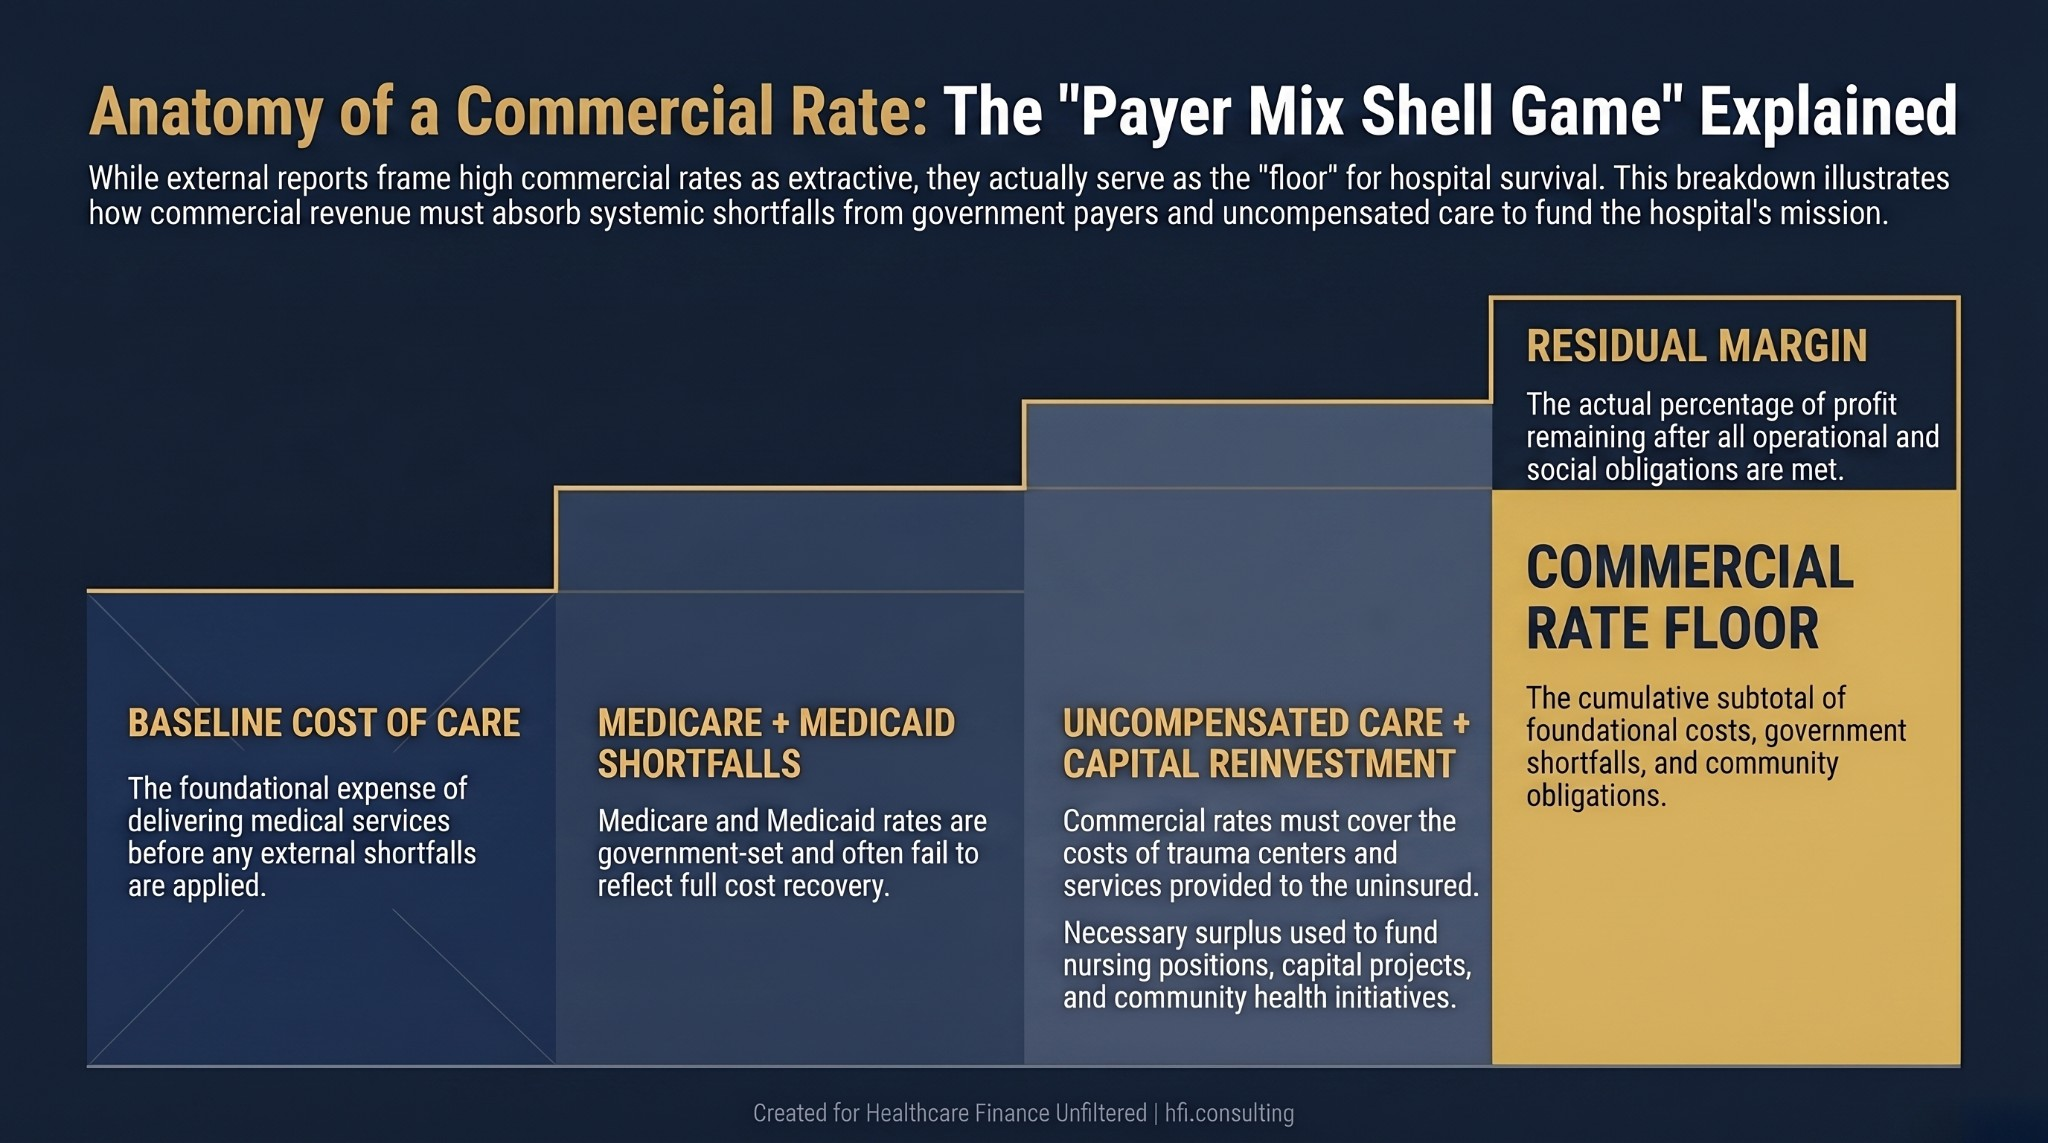
Layered cost waterfall diagram showing how commercial hospital rates compensate for Medicare and Medicaid underpayment shortfalls and uncompensated care volume
The Nonprofit Model Question Is More Complicated Than the Report Allows
One of the more pointed findings in the Families USA analysis: nonprofit hospitals charged an average of 276% of Medicare, nearly identical to for-profit systems at 297%. The report treats this as evidence that nonprofit tax-exempt status provides no consumer protection against high prices.
This conclusion overstates what the tax-exempt structure is supposed to do. Nonprofit status is not a price control mechanism. It is an organizational structure tied to community benefit obligations, governance requirements, and reinvestment mandates. The net income a nonprofit hospital generates does not go to shareholders. It funds capital projects, behavioral health programs, workforce development, and community health initiatives that would not exist on a purely commercial return model.
That said, the report raises a legitimate accountability question for finance leaders: are your community benefit investments calibrated to match the margin advantage the organization generates from its commercial payer mix? The IRS Schedule H filing is the public accountability mechanism for this. If your community benefit spend has not kept pace with commercial margin growth, the regulatory and reputational exposure is real. The earlier analysis on ACA Subsidy Expiration and Community Benefit Strategy covers the framework for getting ahead of that exposure.
What the Antitrust Environment Actually Changes
The consolidation data in the Families USA report maps closely to what the DOJ and FTC have been documenting in their enforcement actions. In 42 states, five or fewer health systems deliver more than half of all hospital care. In 22 states, three systems deliver more than half.
That degree of market concentration is not inherently illegal. It may be the product of strategic affiliation decisions that protected community access to care rather than eliminated it. But it does create the pricing dynamics the report describes, and it creates the enforcement risk environment that is now active. The DOJ Hospital Antitrust Crackdown analysis covered the specific contractual clauses under DOJ scrutiny: anti-steering provisions, all-or-nothing bundling, anti-tiering language. Those clauses exist in large-system contracts because they preserve payer mix leverage. They are now under active legal challenge.
For CFOs, the practical question is not whether the Families USA numbers are fair to your organization. The practical question is whether your current contracting posture is defensible in the current enforcement environment.
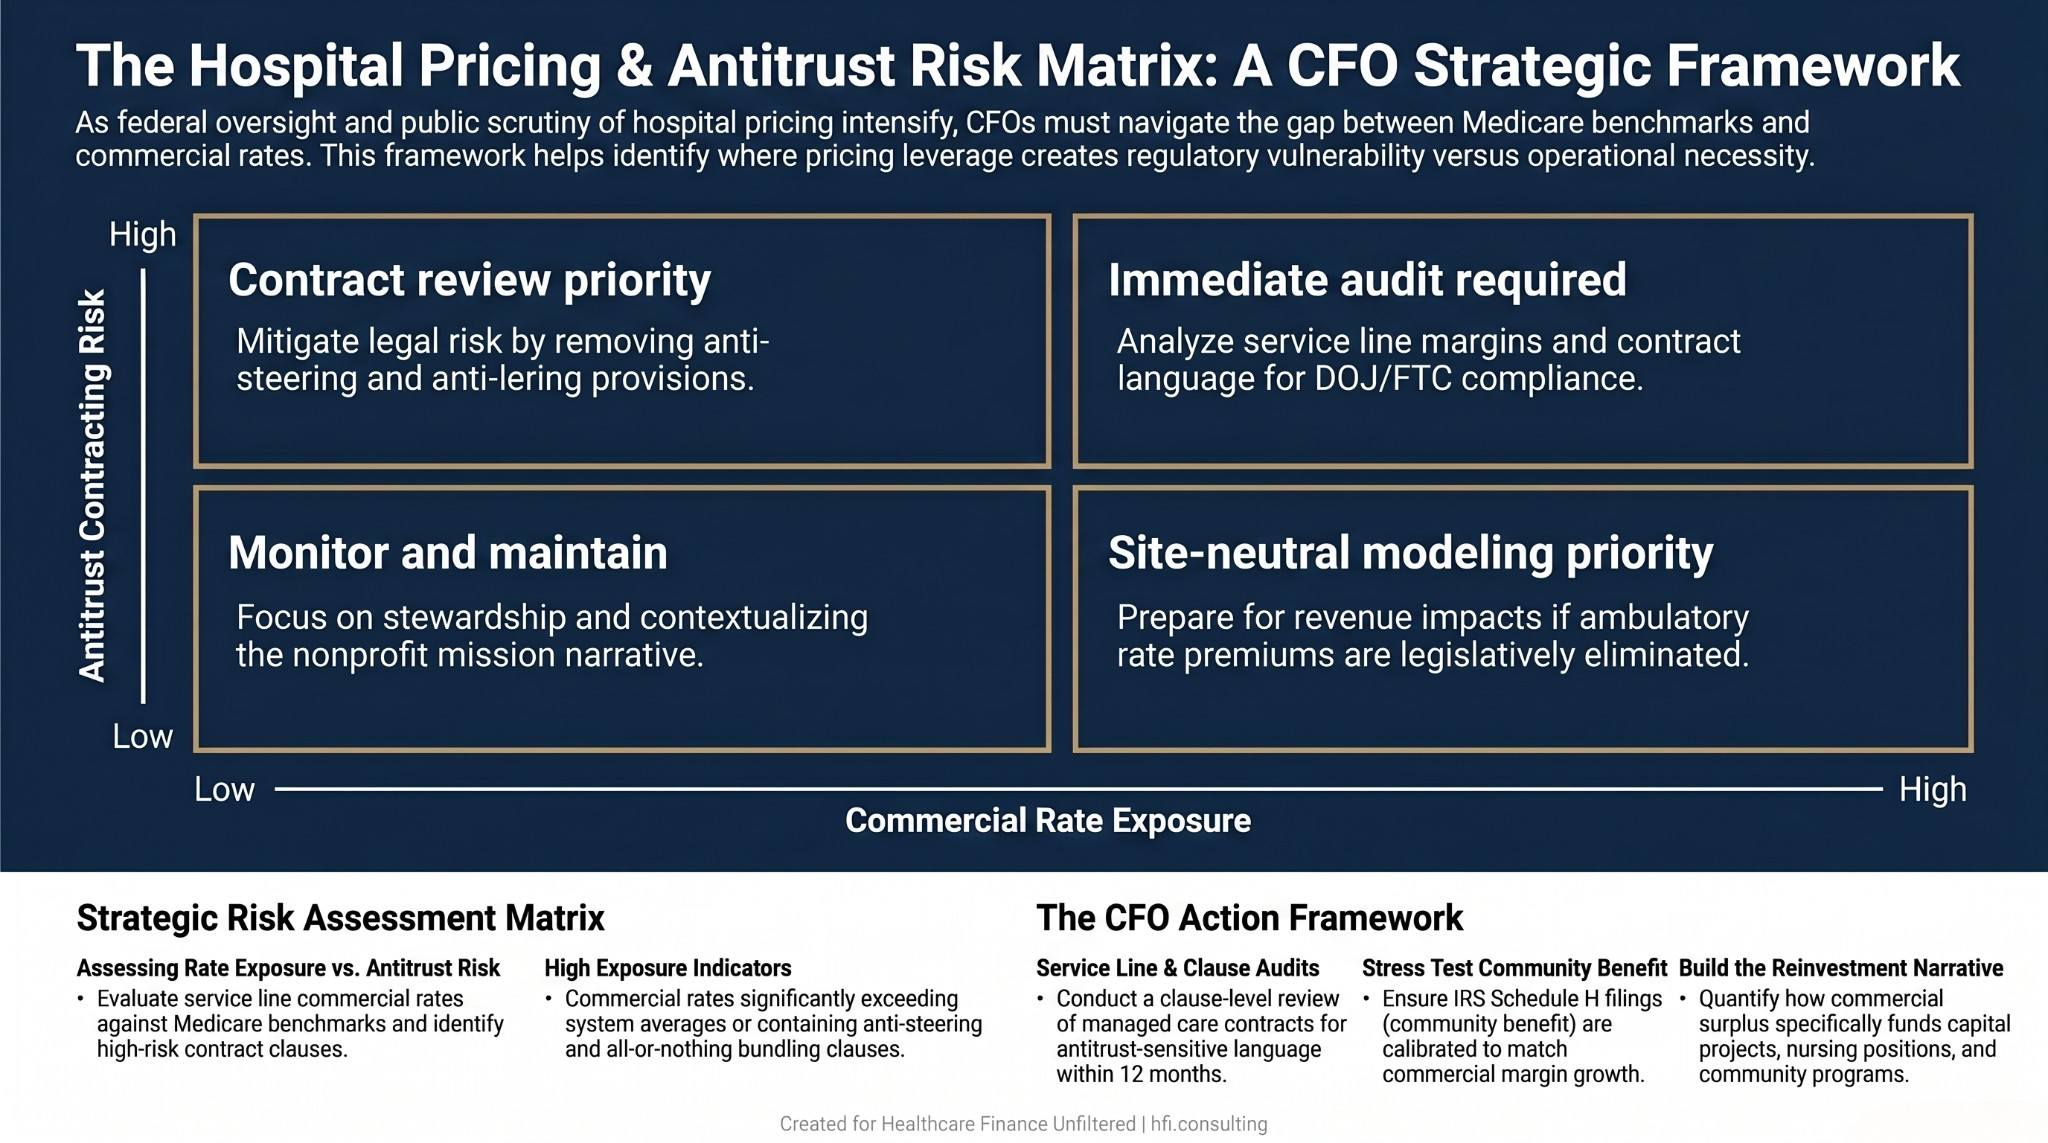
Four-quadrant risk matrix for health system CFOs assessing commercial rate exposure and antitrust contracting risk with recommended actions by scenario
The CFO Action Framework: What This Debate Means for Your Planning Horizon
Working as a finance leader in a large health system has always meant navigating two simultaneous narratives: the "Big Business" critique and the "Community Backbone" reality. The Families USA report does not change that tension. It amplifies it at a policy moment when Congress has tools it is actively considering using.
The five legislative proposals in the Families USA report: site-neutral payment expansion, mandatory price transparency, anticompetitive practice prohibitions, nonprofit oversight strengthening, and hospital price growth caps relative to Medicare benchmarks. None are new ideas. Several have active bipartisan support. The commercial pricing data in this report provides the evidentiary foundation that lawmakers have needed to move them forward.
Step 1: Audit your commercial rate exposure by service line. If your system has service lines generating commercial rates significantly above your system average, understand what cost and payer mix dynamics justify that differential. If site-neutral payment legislation passes, the ambulatory rate premium disappears. Model that scenario now.
Step 2: Review your payer contracts for antitrust-sensitive clauses. Anti-steering, all-or-nothing bundling, and anti-tiering provisions are the specific language under DOJ scrutiny. If your managed care contracting team has not done a clause-level review in the past 12 months, that is an executive risk conversation, not a contracting detail.
Step 3: Stress test your community benefit position. If your system's commercial pricing generates the kind of net income the Families USA report documents, your Schedule H filing needs to reflect it. Community benefit credit is not limited to charity care. Health professions education, SDOH screening programs, community health worker costs, and subsidized services all qualify. Use them.
Step 4: Build the nonprofit mission narrative in financial terms. Board presentations and community communications that respond to reports like this need specific reinvestment data. Not "we reinvest our surplus." Specific: how many nursing positions, capital projects, and community programs are funded by that margin. The Kaiser Permanente profit narrative analysis is a useful reference point for how quickly this becomes a reputational issue when the numbers are not contextualized.
If you want a structured approach to evaluating your system's commercial rate exposure and developing a CFO-level response framework, HFI Consulting works through exactly these questions with health system finance teams. Connect with us at hfi.consulting.
The Moral Margin: Why the Numbers Are Not the Whole Story
There is a phrase that circulates in healthcare finance circles that is worth naming directly: no margin, no mission. It is not a cynical statement. It is an operational truth.
If the finance function does not perform well enough to generate the surplus that funds the next NICU expansion, the oncology center renovation, or the community health worker program, those things do not happen. The lights going on at 3 AM when a family arrives at the emergency department require payroll, equipment, and capital investment that does not materialize through goodwill alone.
The Families USA report frames commercial pricing as a transfer from patients to corporations. The AHA frames it as the structural reality of operating in a system where government programs chronically underpay. Both framings are politically motivated. Neither fully captures what finance leaders are actually doing when they sit in contract negotiations, build zero-based budgets, and model capital allocation scenarios.
What is actually happening is stewardship: of resources that make modern medicine possible in markets where no alternative financing mechanism exists. The role is complicated. The accountability is real. And the policy pressure is intensifying regardless of which framing a given report prefers.
For a deeper look at how the legislative environment around hospital pricing connects to the budget planning questions your team is working on now, the Hospital Price Inflation vs. Insurer Margins analysis covers the payer side of this same debate.
What Comes Next for Finance Leaders
The Families USA report is not the last word on hospital pricing. It is the opening brief for a legislative argument that has been building for several cycles. Finance leaders who treat it as a communications problem will be behind the curve when the policy conversation reaches their budget cycle.
The more productive framing: this is a scenario planning trigger. What does your budget look like under site-neutral payment? What changes in your commercial contracting posture if anti-tiering provisions are restricted? What is the financial impact if the largest systems in your market lose the leverage that currently structures your referral relationships?
Those questions do not have comfortable answers. But they are the right questions. Finance leaders who have modeled them will be better positioned than those who have not when the policy timeline compresses.
If your team is working through those scenarios, connect with HFI Consulting. This is the kind of operational finance work that translates policy headlines into budget-ready analysis.
P.S. What is the single biggest pressure point the hospital pricing debate creates for your finance team right now: the policy uncertainty, the board communication burden, or the contracting environment? Hit reply and tell me. These responses shape what I cover next.
