
The Senior Care Continuum: A CFO's Financial Architecture Guide to the Fastest-Growing Sector in Healthcare
From independent living real estate to SNF Medicaid reimbursement, the financial models are more different than most healthcare CFOs realize.
The 65-plus population in the United States is projected to reach 73 million by 2030, and the senior living sector needs 806,000 additional units to absorb that demand. Only 322,000 are expected to be delivered. For healthcare finance leaders, that gap is not a policy headline. It is a decade of supply-constrained revenue opportunity sitting on top of one of the most financially complex care spectrums in the industry.
As I covered in Aging America 2026: The CFO's Financial Roadmap for the Coming Senior Care Surge, the demographic wave driving senior care demand is not speculative. The 65-plus cohort is the fastest-growing segment of the U.S. population, and the financial implications for every level of the care continuum are already in motion.
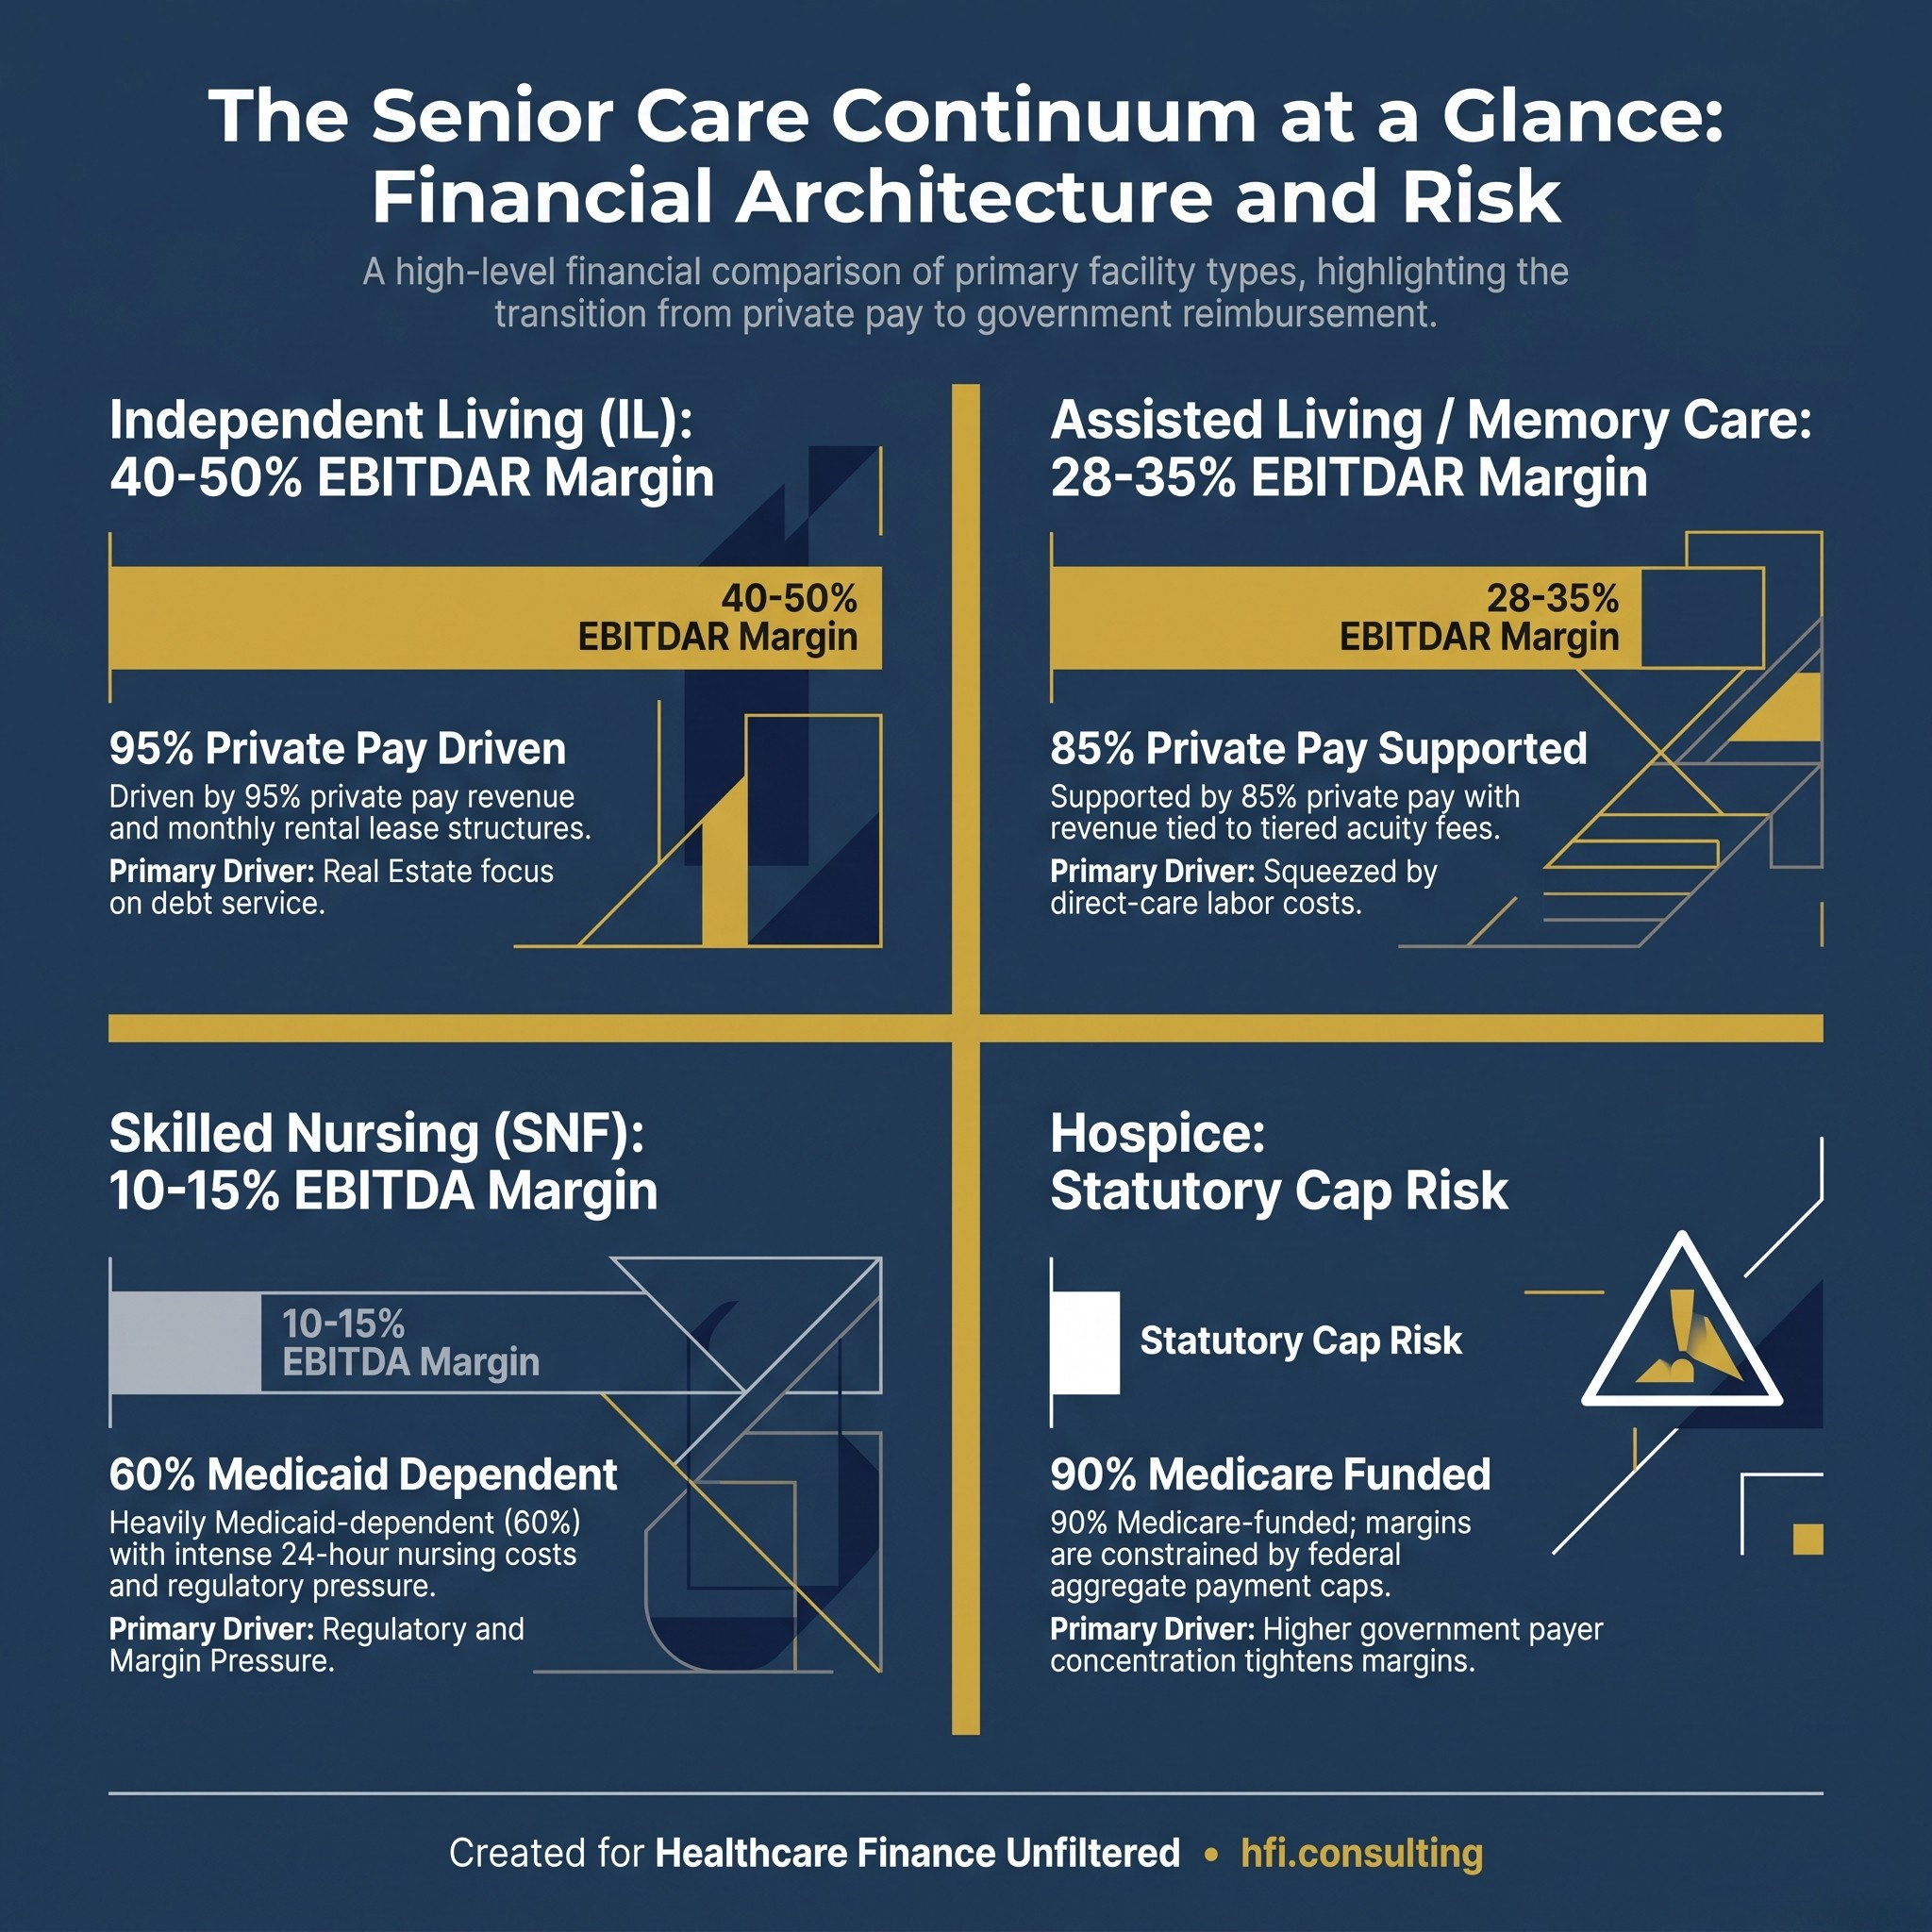
Infographic showing four senior care facility types with payer mix and margin ranges: Independent Living (95% private pay, 40-50% EBITDAR), Assisted Living (85% private pay, 28-35% EBITDAR), Skilled Nursing (60% Medicaid, 10-15% EBITDA), and Hospice (90% Medicare, statutory cap risk).
Most healthcare finance leaders understand hospital margins. Many have spent careers in revenue cycle, payer contracting, or capital planning for acute-care systems. But the senior care continuum operates under a fundamentally different financial architecture, and the differences compound at every level of the spectrum.
This is not a survey of the industry. This is a working CFO guide to what the financial models actually look like, where the margin pressure lives, and what the structural vulnerabilities are that do not appear in the headline data.
Independent Living Is Real Estate, Not Healthcare
The first and most important thing healthcare finance leaders need to understand about Independent Living (IL) is that it behaves like multi-family real estate, not a healthcare delivery system.
Primary payer mix is 95-plus percent private pay. Revenue is driven by monthly rental lease fees plus amenities charges. There are no Medicare or Medicaid reimbursement flows, no clinical staffing ratios mandated by the state, and in most markets, no Certificate of Need requirement.
EBITDAR margins in well-operated IL communities run 40 to 50 percent. That number sounds high until you look at the balance sheet. The dominant cost driver is real estate debt service. Ground-up IL development carries capital costs in the range of $25 million to $60 million or higher depending on market, and lease-up timelines run 18 to 24 months before a community reaches stabilized occupancy.
The regulatory burden is light. Most states treat IL communities as unlicensed or lightly regulated residential settings, similar to apartment complexes with dining services. The risk exposure is primarily real estate risk: interest rate sensitivity, construction cost escalation, and the occupancy curve between opening and stabilization.
For CFOs coming from health system backgrounds, IL is worth understanding as a potential joint venture or affiliate opportunity. The capital decision framework here is the same one I outlined in Health System Portfolio Rationalization: The CFO's Framework for Growing Up Instead of Out: the question is not whether the asset class has value, but whether the financial diligence framework matches the actual business model. For IL, that framework is fundamentally a real estate underwriting exercise, not a healthcare pro forma.
Assisted Living and Memory Care: Where Private Pay Meets Clinical Complexity
Assisted Living (AL) and Memory Care (MC) facilities operate in a materially different financial environment than IL, even though the payer mix remains primarily private pay at approximately 85 percent.
Revenue in AL and MC is structured as a base monthly rate plus tiered acuity or care-point fees. As residents' needs increase, the monthly rate adjusts upward through a point-based or acuity-tier system. This creates a revenue model that should theoretically self-adjust for clinical complexity. In practice, the acuity assessment process is highly operator-dependent, and under-assessment is a common source of margin erosion.
EBITDAR margins in AL and MC run approximately 28 to 35 percent. The primary cost driver is direct-care labor: aides, medication technicians, and in memory care settings, specialized dementia-capable staff. Turnover costs in this workforce segment are substantial. The senior care sector overall faces a documented shortage of up to 3.2 million healthcare workers by 2026, with an additional 73,000 nursing assistants projected to be needed by 2028.
State licensure adds a regulatory layer that IL does not carry. In Florida, the Agency for Health Care Administration (AHCA) governs AL licensing. In New York, the Department of Health. Staffing ratio minimums vary by state and by care level, and survey findings can generate remediation costs that hit operating margins directly.
The Medicaid Home and Community Based Services (HCBS) waiver programs add a partial payer complexity in some markets. States with robust HCBS waiver programs can create a Medicaid-funded census segment in AL, which changes the revenue mix and the acuity dynamics simultaneously.
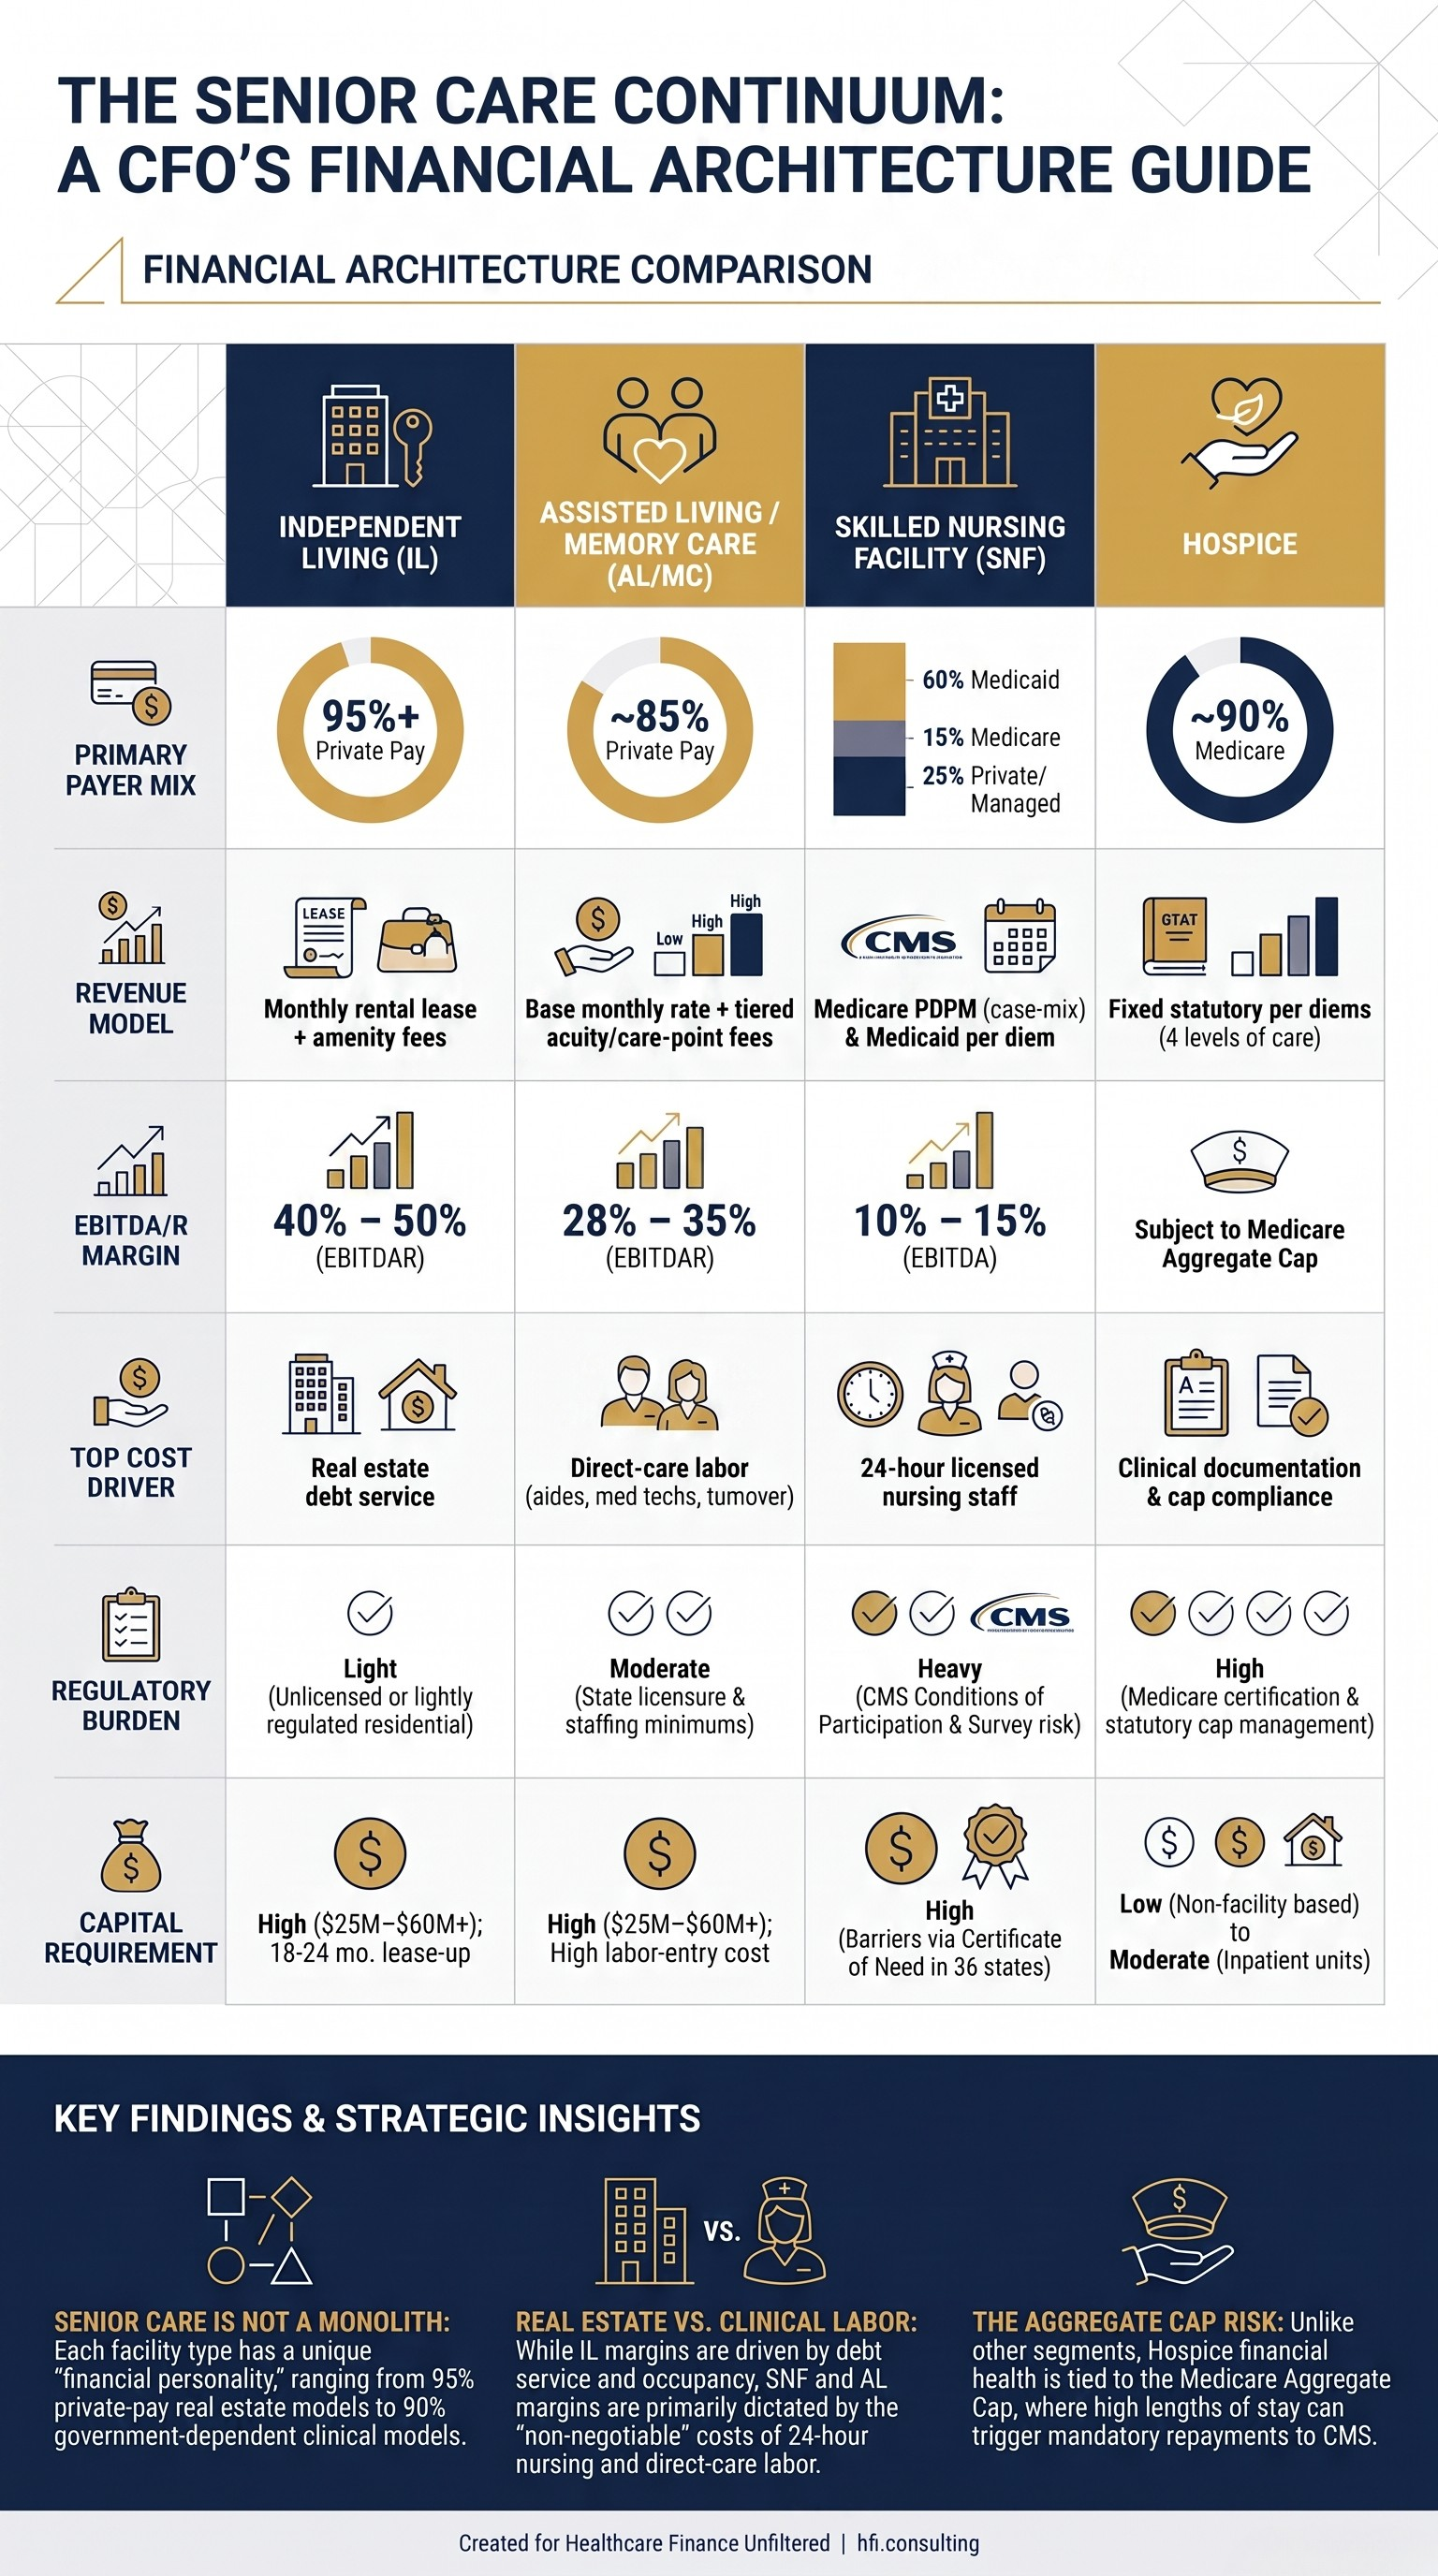
Comparison table of senior care facility types showing payer mix, revenue model, margins, cost drivers, regulatory burden, and capital requirements for Independent Living, Assisted Living/Memory Care, Skilled Nursing, and Hospice.
Skilled Nursing: Where Government Reimbursement Dominates and Margins Are Thin
Skilled Nursing Facilities (SNFs) are the most regulated, most Medicaid-dependent, and most margin-constrained segment of the senior care continuum.
The payer mix in a typical SNF runs approximately 60 percent Medicaid, 15 percent Medicare, and 25 percent private pay and managed care. Medicare short-stay post-acute episodes are reimbursed under the Patient-Driven Payment Model (PDPM), which went into effect in 2019 and replaced the prior Resource Utilization Group (RUG) system. PDPM uses a case-mix model based on clinical categories, functional status, and comorbidity weights to generate a per diem rate. The financial management challenge is that accurate case-mix capture requires clinical documentation discipline that many SNFs underinvest in.
EBITDA margins in SNFs run approximately 10 to 15 percent. The 24-hour licensed nursing requirement is non-negotiable and is the dominant cost structure. CMS Conditions of Participation are exhaustive. Survey risk is material: a CMS Civil Money Penalty or immediate jeopardy finding can result in six-figure remediation costs and Medicare and Medicaid payment suspension.
Certificate of Need (CON) requirements add a capital barrier in the 36 states that still maintain some form of CON regulation for SNF bed additions. In Florida, AHCA administers CON for SNF beds, which effectively limits new supply and protects existing operators but also constrains growth.
From my work with health system clients and in my own background spanning multi-hospital financial operations, SNF joint ventures and affiliations are among the most financially misunderstood transactions in post-acute strategy. The margin looks thin in isolation. The value is strategic: patient flow control, readmission management, and the revenue cycle impact of post-acute placement on acute-episode reimbursement. The payer mix dynamics in SNF also interact directly with the contribution margin picture at the health system level, which I covered in depth in Contribution Margin Is Lying to You: What the Q2 Payer Mix Crisis Means for Every Level of Healthcare Provider. A 60-percent-Medicaid SNF affiliate changes your consolidated payer mix in ways that belong in the deal model before close, not in the post-integration variance analysis.
Hospice and Palliative Care: Statutory Caps and the Medicare Aggregate Risk
Hospice care operates under the Medicare Part A Hospice Benefit, which is one of the most precisely specified reimbursement structures in the federal healthcare system.
Revenue is based on four levels of care, each with a fixed statutory per diem: Routine Home Care (RHC), Continuous Home Care (CHC), Inpatient Respite Care (IRC), and General Inpatient Care (GIC). The dominant level is Routine Home Care, which carries differentiated per diem rates for Days 1 through 60 and Day 61 forward, creating a declining reimbursement curve as the length of stay extends.
The structural financial risk that most CFOs underestimate is the Medicare Aggregate Cap. Each hospice provider number has an annual aggregate cap that limits total Medicare hospice payments per beneficiary. If a hospice exceeds its cap, it must repay the overage to CMS. For hospices with high average length-of-stay populations, cap management is not an accounting exercise. It is a strategic enrollment and clinical management challenge.
The payer mix is approximately 90 percent Medicare. That concentration creates reimbursement certainty but also regulatory concentration risk. OIG has hospice cap compliance and benefit period documentation as standing audit priorities. The False Claims Act exposure in hospice is significant when documentation of terminal prognosis does not meet the six-months-or-less standard across the Medicare-certified census.
The Residential Assisted Living Model: Small Footprint, Distinct Economics
One segment of the senior care market that receives less attention from institutional finance leaders but represents a meaningful growth trend is the Residential Assisted Living (RAL) model: single-family residential homes converted to licensed 5-to-16-bed care environments.
The unit economics are materially different from institutional AL. A 6-to-8-bed RAL home operating at $6,500 per resident per month generates gross revenue of approximately $39,000 monthly. After 24/7 caregiving labor at roughly $16,000, real estate or debt service at $6,500, food, utilities, insurance, and supplies at $4,500, and management and miscellaneous costs at $2,000, the net operating income reaches approximately $10,000 per month. Operating margins run 25 to 30 percent.
The capital efficiency advantage is significant. RAL conversion capital costs run $150,000 to $400,000 for residential acquisition and retrofit, compared to $25 million to $60 million or more for ground-up institutional AL development. Lease-up velocity is dramatically faster: breakeven requires filling only 3 to 4 beds, typically achieved within 3 to 6 months versus 18 to 24 months for an 80-bed commercial community.
The financial vulnerabilities are equally significant. In a 6-bed home, losing one resident creates an immediate 16.7 percent revenue drop while fixed costs remain unchanged. Acuity creep as residents age in place creates staffing pressure: when a single-caregiver night shift becomes clinically unsafe, adding a second awake caregiver can reduce operating margins by 30 to 40 percent in a single decision.
The regulatory environment adds a pre-opening friction layer that many operators underestimate. Under the Fair Housing Act, local municipalities cannot block licensed care homes for elderly or disabled individuals. But fire sprinkler requirements, setback rules, and parking minimums frequently generate expensive delays and remediation costs before the first resident moves in.
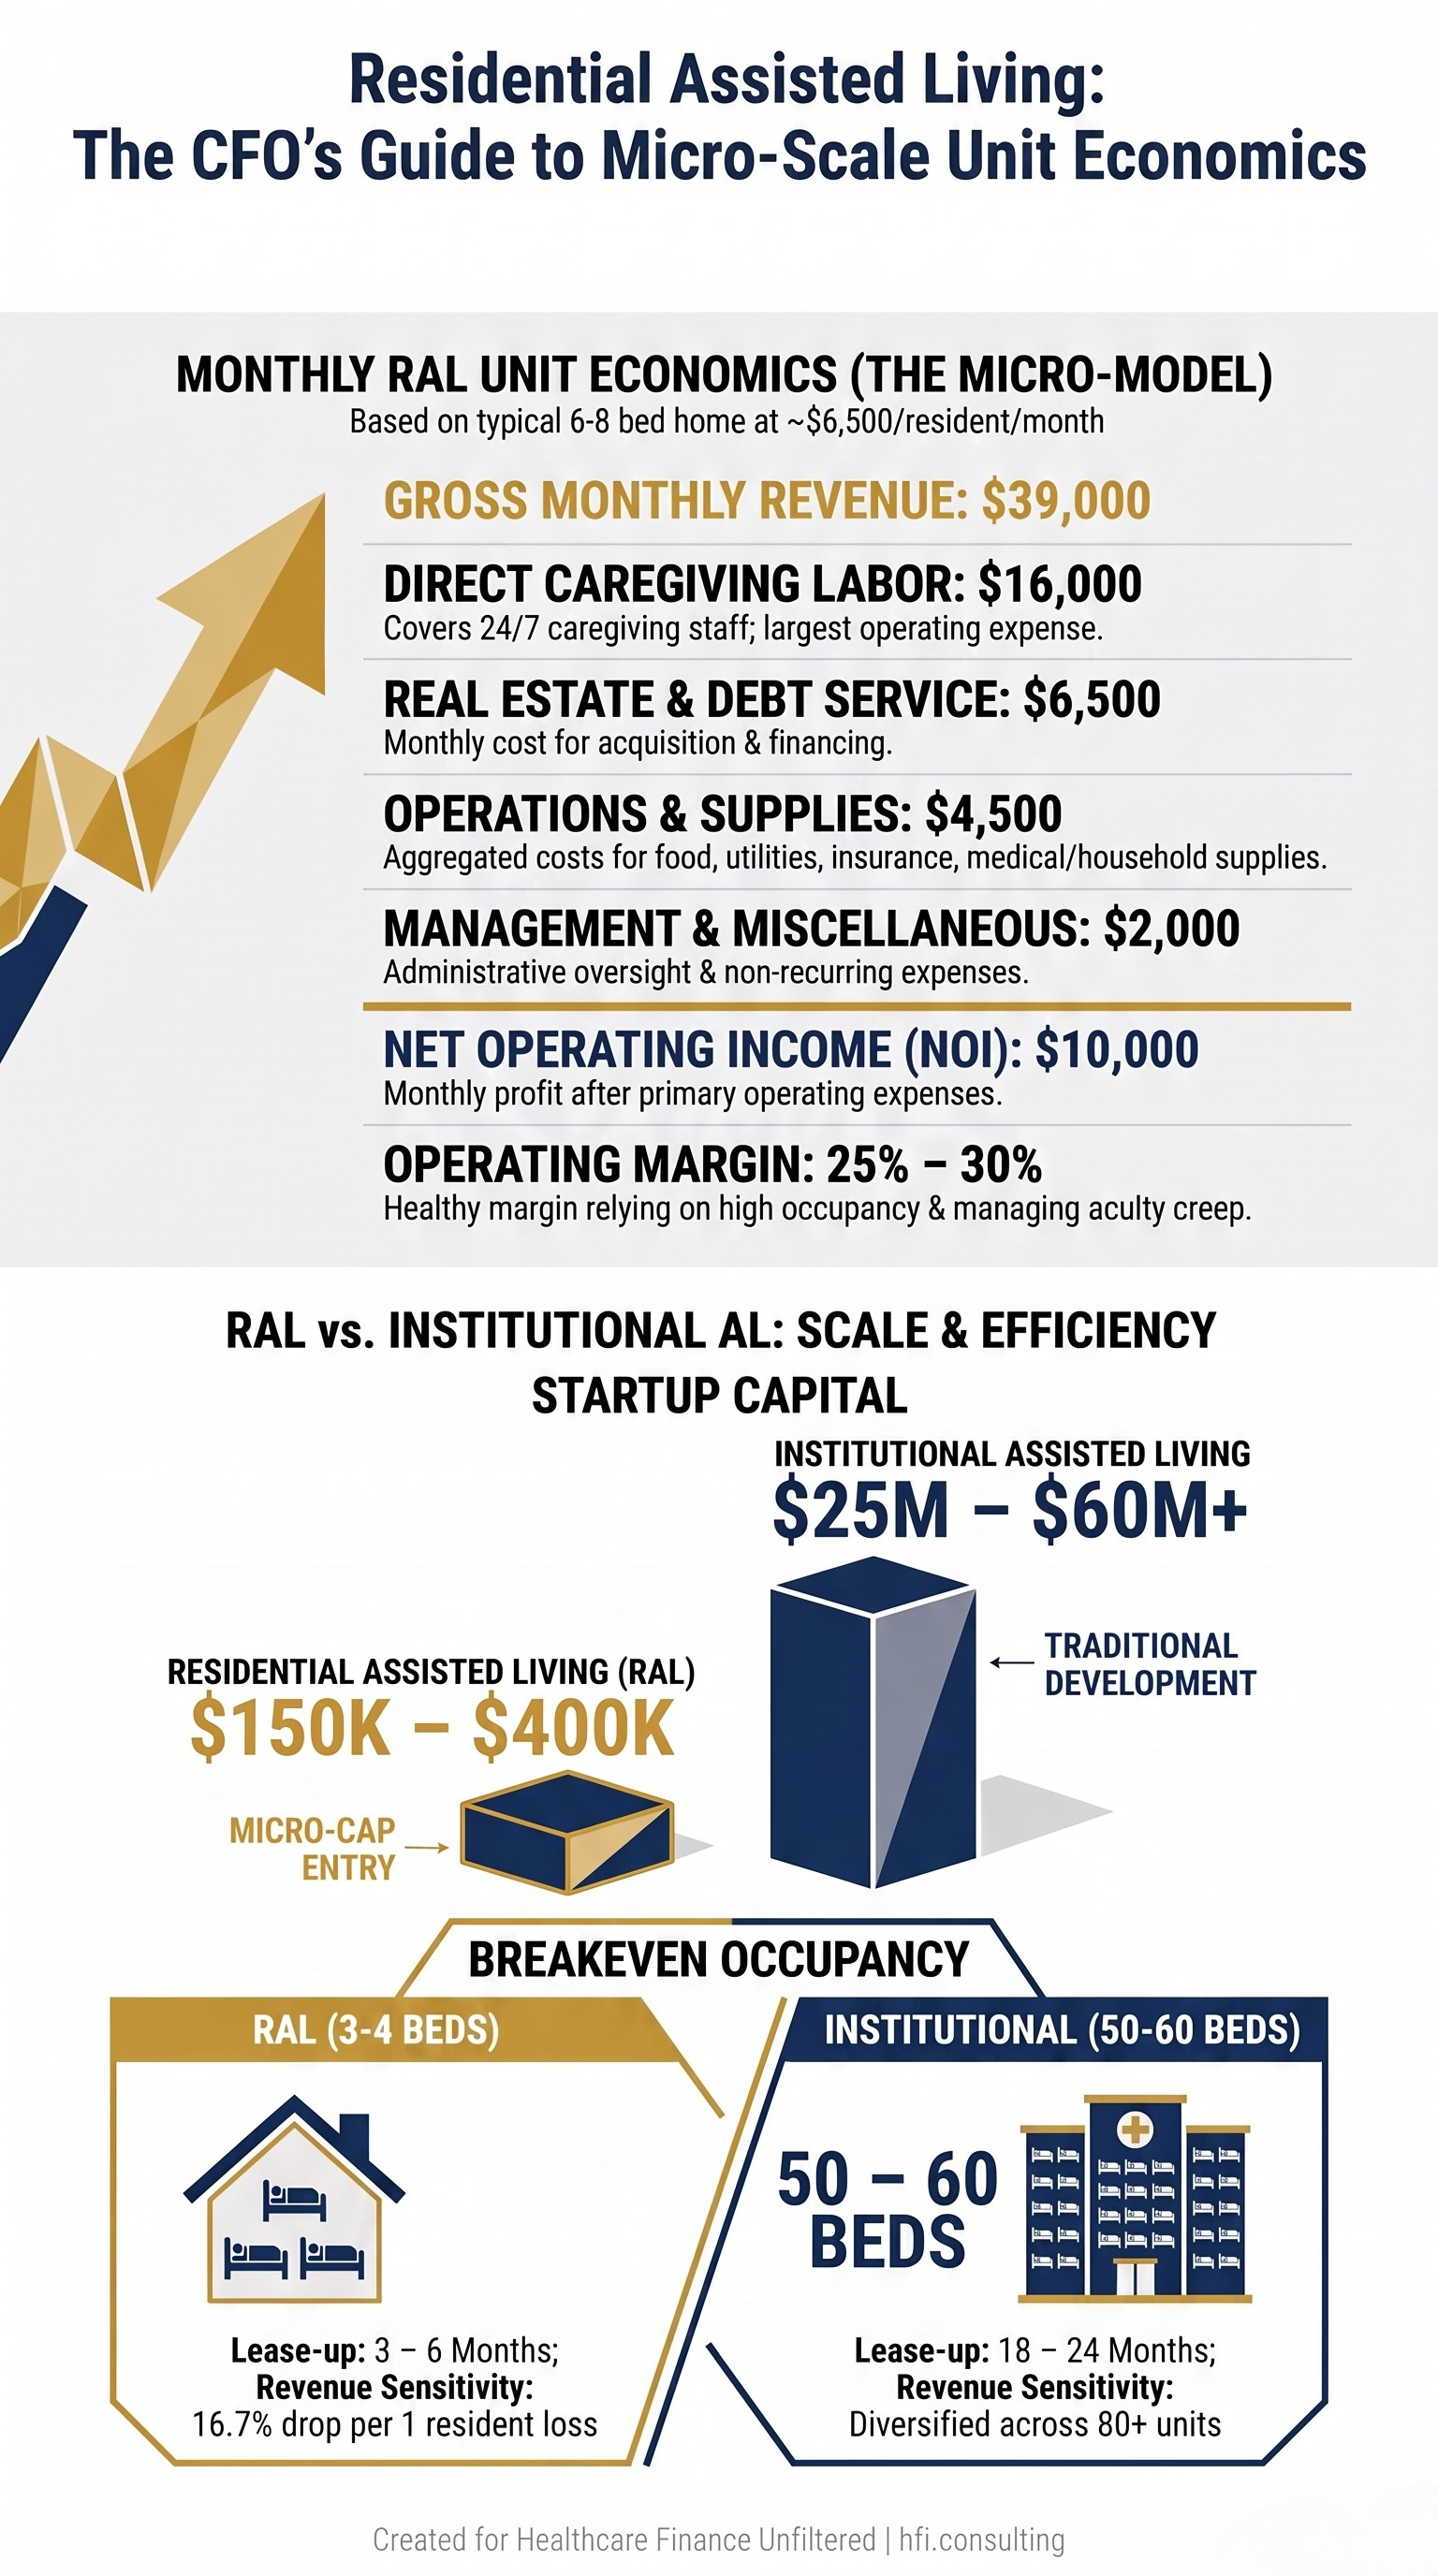
Financial model showing Residential Assisted Living unit economics for a 6-8 bed home: $39,000 gross revenue, $29,000 in costs, $10,000 net operating income, 25-30% margin, compared to institutional AL capital requirements of $25-60 million versus RAL's 150,000-400,000.
What Senior Care Finance Leaders Are Facing Now
The Sage CFO Growth Code survey of 600 senior finance leaders published in August 2026 documented the scale of the operational challenge: 86 percent say their current technology stack needs improvement, 74 percent say they are not using AI to its fullest potential, and 79 percent are prioritizing process automation as the primary response to staffing gaps.
These are not aspirational priorities. They reflect the operational reality of managing labor-intensive care models with workforce shortages, legacy accounting systems that cannot surface multi-site consolidated reporting without manual intervention, and margin environments that leave little room for absorption of implementation costs.
The finance leader's role in senior living has expanded materially. According to the same survey, 79 percent of healthcare finance leaders say their role has changed significantly in the past two years. 84 percent are now engaged in non-traditional responsibilities including HR strategy, technology selection, and digital transformation planning. 93 percent expect this expansion to continue.
This is the operating environment where strategic financial decisions are being made. Not in conditions of stability and incremental improvement, but in conditions of structural workforce shortage, capital constraint, and regulatory complexity across multiple facility types simultaneously.
If you are evaluating a senior care acquisition, an affiliation, a joint venture, or a new service line, the financial architecture of each segment demands separate analytical treatment. The margins, the payer dynamics, the regulatory exposure, and the capital requirements are different enough across the continuum that a single pro forma framework applied across facility types will produce systematically wrong conclusions.
HFI Consulting works with health system CFOs and senior living finance leaders on acquisition due diligence, service line financial modeling, and post-acute strategy. If you are evaluating a senior care transaction or restructuring your post-acute financial framework, reach out at hfi.consulting.
The Staffing Crisis Is a Finance Problem, Not Just an Operations Problem
The workforce shortage data in the senior care sector is not background context. It is the primary variable in every margin model.
One analysis projects a shortage of up to 3.2 million healthcare workers by 2026. A separate study projects a shortage of 73,000 nursing assistants by 2028 specifically. New immigration policy changes have reduced the available labor pool in a sector where immigrants make up 28 percent of the long-term care workforce, compared to 19 percent in other sectors. That same labor supply constraint is compounding construction workforce shortages, making new unit development more expensive and slower.
For AL and SNF operators, the staffing cost response has been a combination of wage increases, agency and registry labor at premium rates, and technology investment in scheduling optimization and virtual care applications. Systems using AI-driven workforce optimization platforms have reported 5 to 12 percent reductions in premium pay. That is not a marginal improvement in a 10 to 15 percent EBITDA environment. It is a material margin lever.
The technology adoption barriers the Sage survey identified are worth naming directly: 39 percent of senior living finance leaders cite integration with existing systems as the primary barrier to AI investment, 33 percent cite lack of understanding of AI benefits, 33 percent cite security and privacy concerns, and 26 percent cite budget constraints. These are not excuses. They are the actual obstacles, and finance leaders who can build an internal business case that addresses each one directly will move faster than those waiting for vendor-led education.
The CFO's Framework for Evaluating Senior Care Opportunities
Whether you are a health system CFO evaluating a post-acute affiliate, a senior living operator preparing for a capital raise, or a consulting finance leader reviewing an acquisition target, the analytical starting point is facility type.
Match the reimbursement model to the analytical framework. IL is underwritten as real estate. AL and MC require acuity-adjusted revenue modeling. SNF requires PDPM case-mix analysis and Medicaid rate sensitivity testing. Hospice requires aggregate cap modeling and length-of-stay distribution analysis.
Stress-test the labor assumptions. Every margin model in senior care is more sensitive to labor cost assumptions than to revenue assumptions. The workforce shortage is structural and is not resolving in a budget cycle.
Understand the regulatory exposure at each level. CMS survey risk for SNFs, state licensure compliance for AL and MC, and Fair Housing Act navigation for RAL are not equivalent risk categories. Each demands specific diligence.
Model occupancy sensitivity by facility type. The occupancy sensitivity of an 80-bed SNF versus a 6-bed RAL home versus a 200-unit IL community is dramatically different. A standard occupancy sensitivity table applied uniformly across facility types will systematically understate RAL risk and overstate SNF risk.
Identify the technology infrastructure gap before closing. 86 percent of senior living finance leaders say their current technology stack needs improvement. In an acquisition, that gap belongs in the purchase price negotiation, not the post-close integration budget.
The senior care sector is experiencing a structural demand surge that is not speculative. The demographic wave is documented, the supply gap is measurable, and the financial architecture of the continuum is learnable. CFOs who understand the model before the transaction will be in a stronger position than those who learn it during integration.
The work of connecting senior care financial strategy to operational execution is exactly what HFI Consulting focuses on. If you are working through a senior care financial decision and want a practitioner-level sounding board, visit hfi.consulting.
P.S. Which segment of the senior care continuum are you watching most closely from a financial strategy perspective: independent living real estate, assisted living and memory care operations, skilled nursing reimbursement, or the residential AL micro-scale model? Hit reply and tell me. The patterns in what CFOs are focused on right now will shape the next piece on this topic.
