
Your Denial Rate Looks Great. Your Revenue Doesn't. Here's Why.
The metric your revenue cycle team lives by may be hiding the exact leakage it was designed to catch.
A new MGMA poll found that 48% of medical practices say denials are their biggest revenue leak. At the same time, revenue cycle leaders at a major industry conference just argued that chasing a lower denial rate can actually cost you money. Both things are true. That is the problem.
The Metric That Ate Itself
Denial rate became the default revenue cycle scorecard because it is easy to see and easy to communicate. Denials go up, something is wrong. Denials go down, things are better.
Except that is not always what is happening.
The MGMA data confirms what most revenue cycle directors already feel: claims are getting rejected, reworked, and written off at a pace that is bleeding practices dry. Forty-eight percent named denials and appeals as their single biggest leak. Another 23% said front-end eligibility and verification failures were the culprit.
What the dashboard does not show is what happened before the denial was ever generated.
The Self-Denial Problem Nobody Reports
Here is the scenario that has played out at health systems across the country.
A hospital sets a goal: reduce Medicare Advantage denial rates. Utilization management responds. Physicians are coached to document differently. More two-midnight stays land in observation rather than inpatient. Appeals are filed selectively, only on cases likely to win.
Denial rate falls. The dashboard looks cleaner. Net inpatient realization falls with it.
This is what some utilization management experts call "self-denial." Lower denials, lower reimbursement, and care that was never billed at the rate it was delivered. The team optimized the payer's metric, not its own revenue.
The pattern shows up in the numbers. Kodiak's first-half 2026 analysis of more than 2,300 hospitals and 375,000 physicians found that providers actually cut initial and final denial rates compared to 2025. Cash still did not improve. Insurers offset those gains with more takebacks, rising from 1.38% to 1.57% of accounts receivable. Providers recovered less on post-payment appeals. Lower denials were not the same as more money.
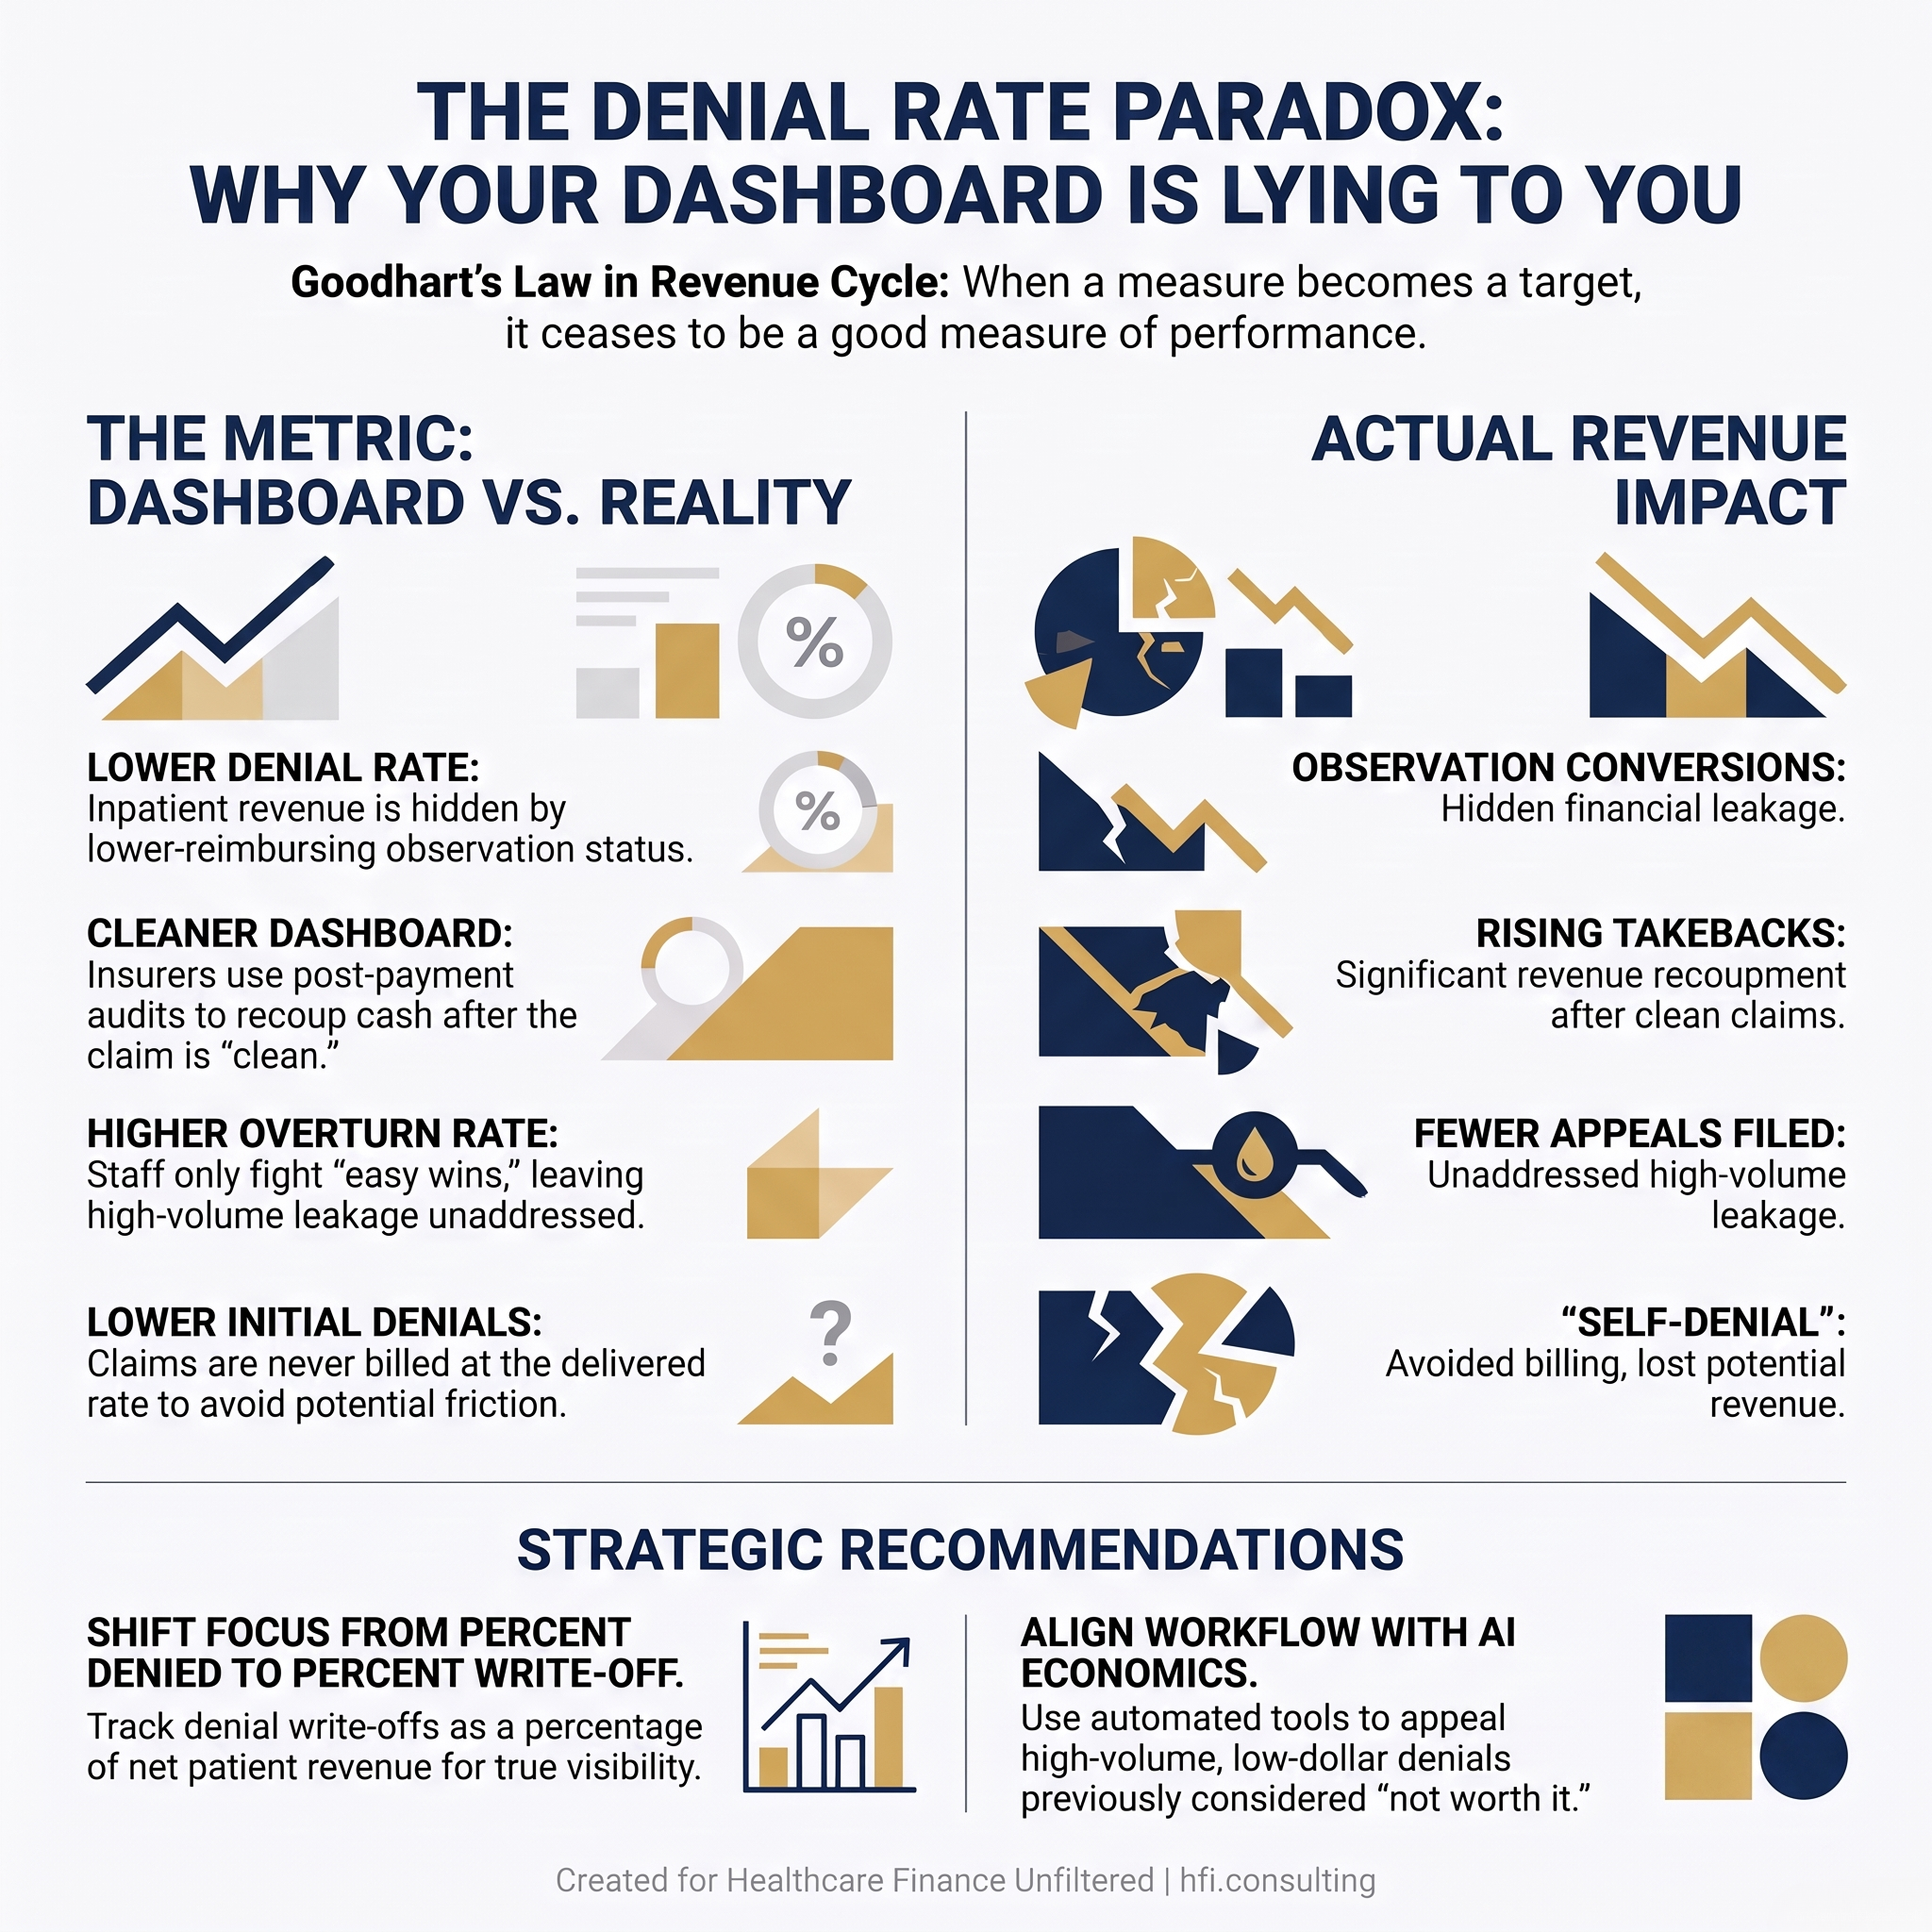
Framework comparing denial rate dashboard metrics to actual revenue impact — showing how a lower denial rate can mask revenue loss through observation conversions and unworked claims
Goodhart's Law Comes to Revenue Cycle
There is a principle in economics called Goodhart's Law: once a measure becomes a target, it ceases to be a good measure.
Revenue cycle is living it.
If your team is tracking denial rate as a primary KPI, here is what can happen in practice. Staff learn which claims are likely to bounce and stop submitting them. Utilization review converts payable inpatient stays to observation to keep the front end clean. Appeal teams focus only on the highest-confidence reversals to protect their overturn percentage. Denials fall. Write-offs quietly accumulate.
The industry data on abandonment has been consistent for years. Roughly half to two-thirds of denied claims are never reworked. That is not a denial rate problem. That is a revenue problem that a clean denial rate will never surface.
HFMA has recognized this for years. They pair denial rate with denial write-offs as a percentage of net patient revenue, time-to-appeal, and actual dollars overturned. Not just percent denied. The direction the metric is pointing matters less than the revenue it represents.
As I described in my earlier piece on what the denial loop is costing both sides of the healthcare transaction, the fight over denials has become an arms race. The cost of running that race is now showing up in every income statement.
What Payer AI Is Actually Doing — And Why Providers Are Behind
Here is where the conversation gets harder.
Payers are not simply processing claims faster. They are running AI systems that decide which cases get real review, how long care is expected to last, which claims get audited, and which denials are statistically safe to issue because almost no one appeals.
That last part matters more than most finance teams realize.
In Medicare Advantage, only about 11.5% of denied prior authorizations are ever appealed. If a payer algorithm is wrong often but cheap to run, and almost no one fights, it still works financially. The business model depends on low appeal rates. And providers who only appeal the biggest-dollar cases are playing directly into it.
What providers are experiencing as random slowness or documentation friction is often risk scoring. Requests get sorted into auto-approve, "needs more documents," and high-risk. The model decides which charts get friction. A human may never touch the case until after the denial is issued.
The length-of-stay prediction tools are a related version of the same problem. The fight in post-acute and SNF denials is no longer your clinical judgment against medical necessity criteria. It is your clinical trajectory against the payer's predicted trajectory, based on historical averages from a large database that does not know your patient.
Payment-integrity AI adds another layer. Payers used to audit samples of claims. Now models scan full claim files for outlier coding, unusual diagnosis-procedure combinations, documentation that looks templated, and providers whose billing patterns diverge from peers. That is why denials and takebacks sometimes arrive in batches and feel coordinated. The model identified a pattern across many claims before any human reviewed a single one.
The service lines where this is most visible: behavioral health, post-acute and SNF, advanced imaging, specialty pharmacy and buy-and-bill biologics, orthopedics, outpatient surgery, home health, and DME. These are the lines where AI-assisted utilization management and post-payment audit tools are most active.
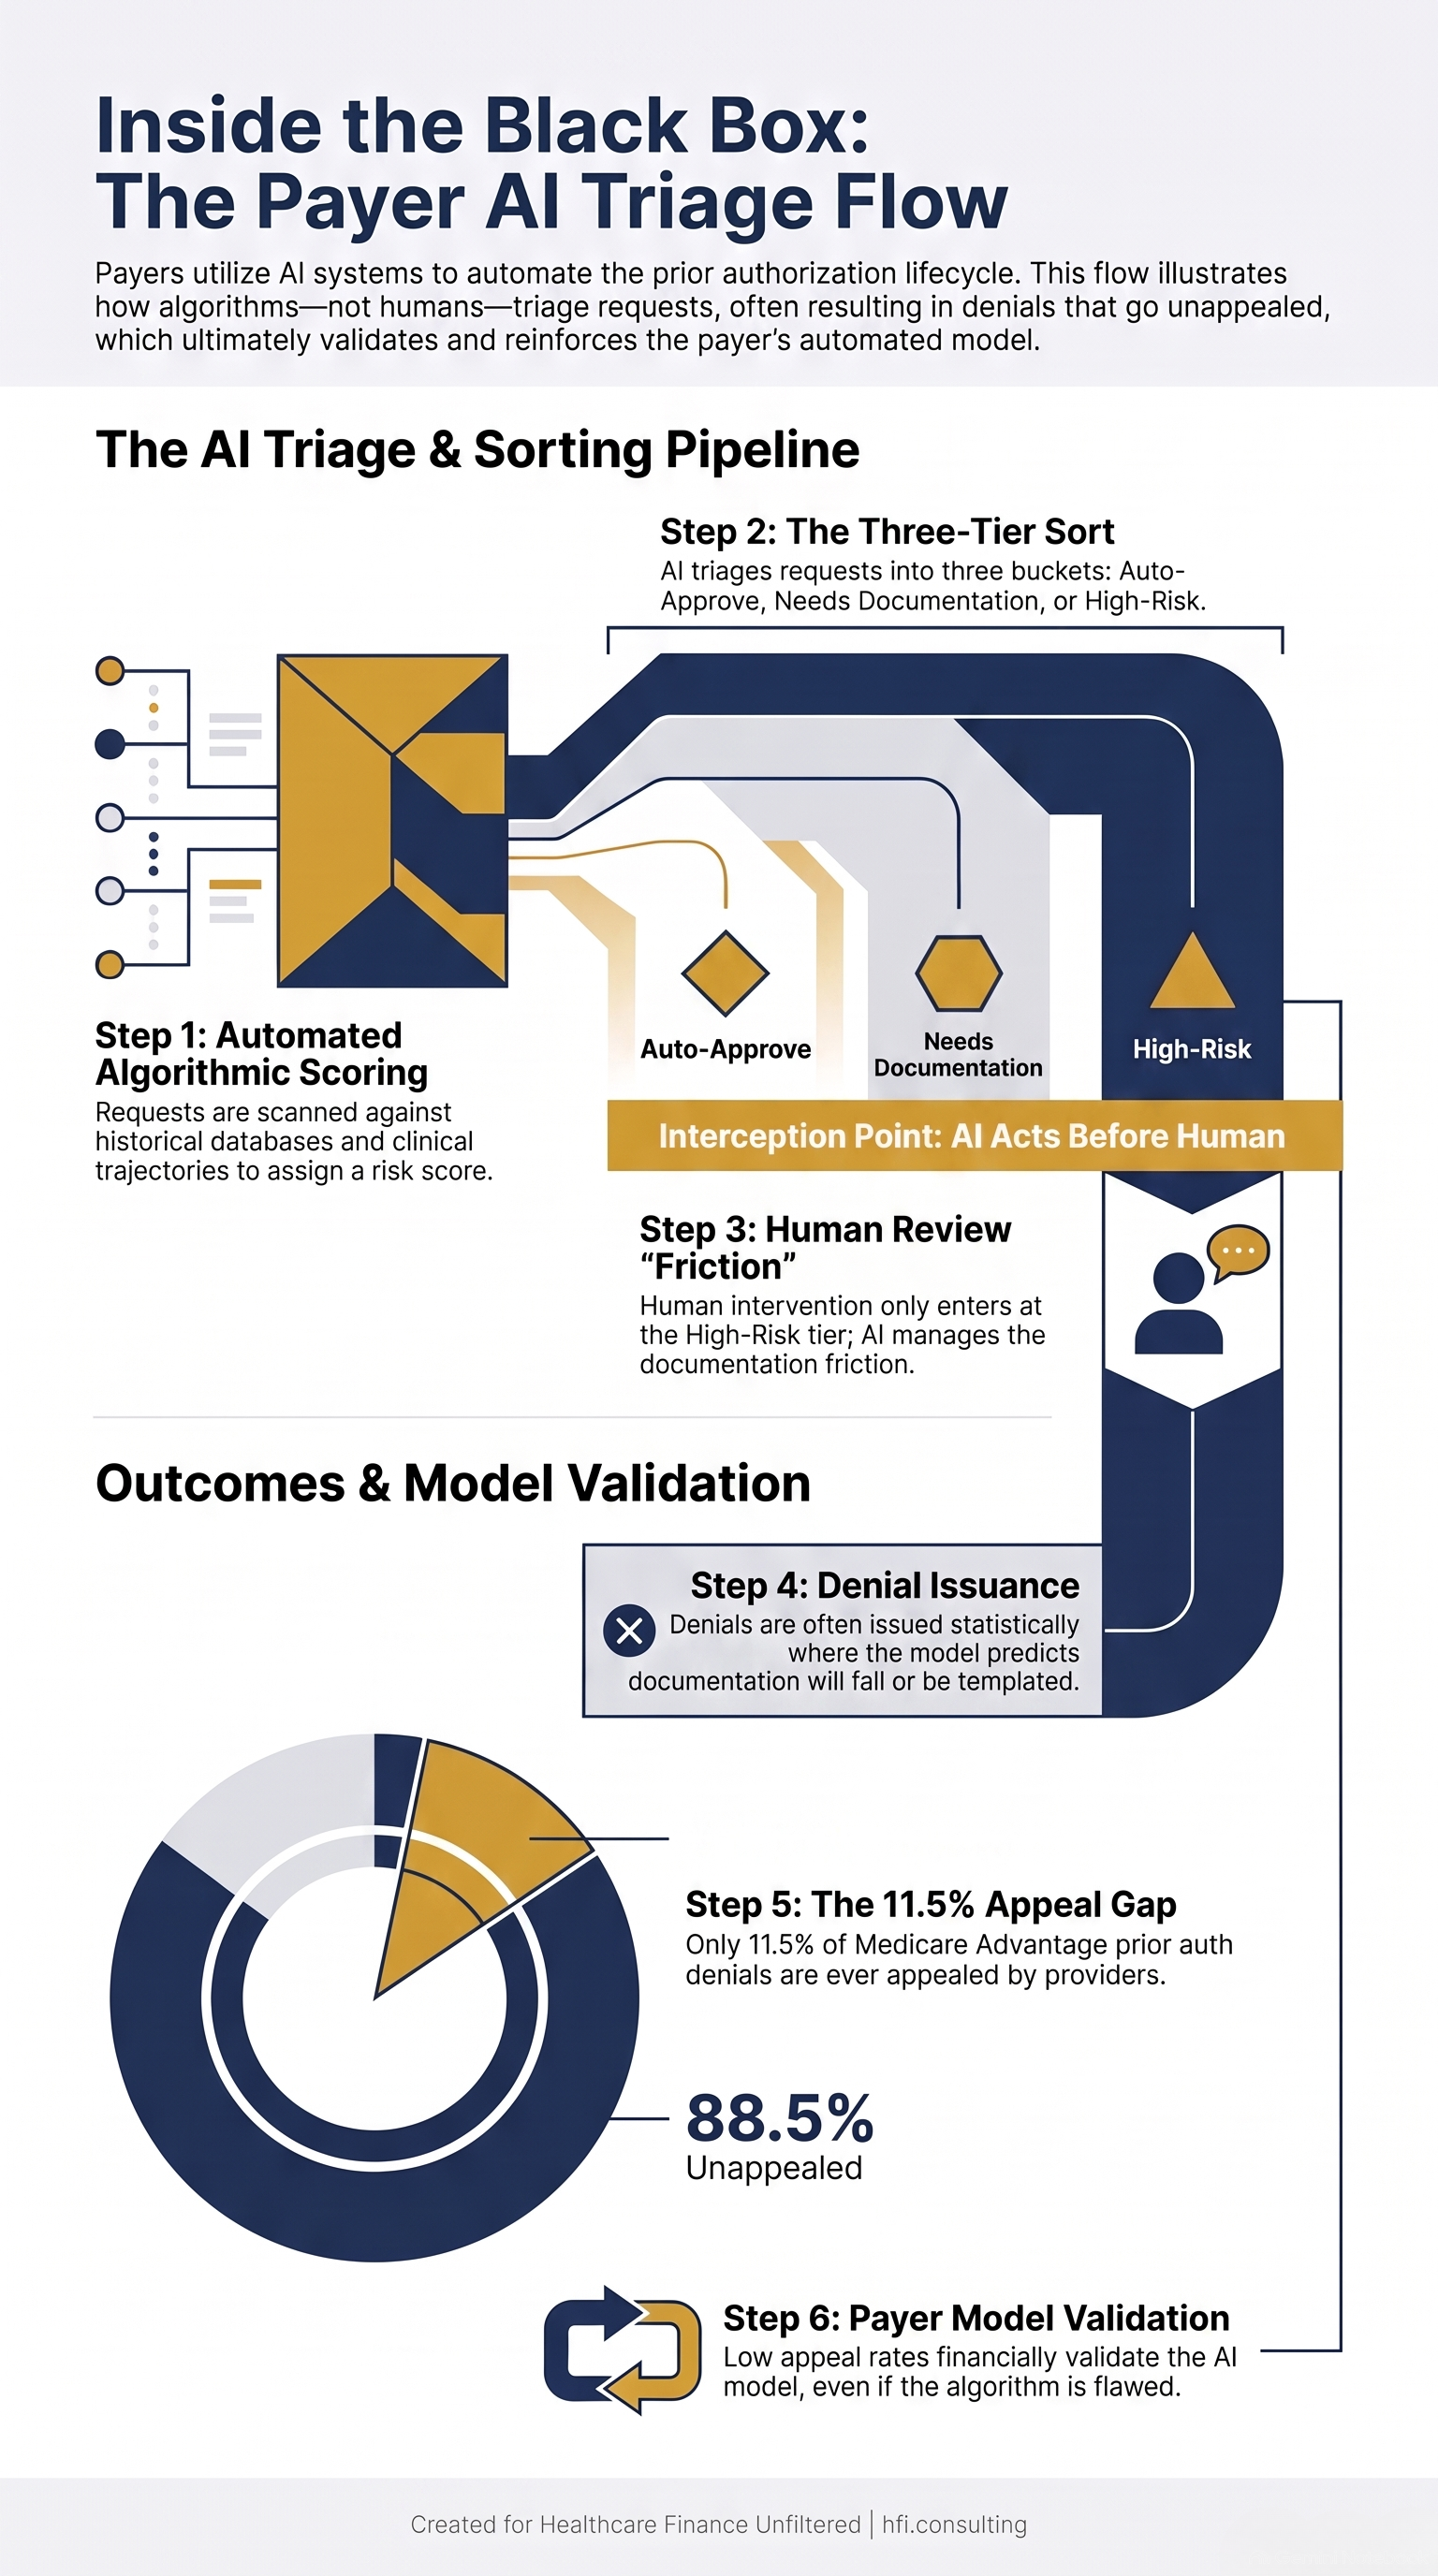
Process flow showing how payer AI routes prior authorization requests through scoring, triage, and selective human review before most denials are issued
"If you're not pushing for appropriate reimbursement, then yeah, you can have a great denial rate. It's not really telling the full story." — Tanya Sanderson, RN, Senior Director of Denial Management, Stanford Health Care
The Metric Problem Is Also a Workflow Problem
The Becker's panel that included revenue cycle leaders from Stanford, NCH Healthcare, Longtail, and PDS Health made a point that deserves more attention: the old assumption that every denial costs $25 to work is no longer accurate.
AI is changing the economics of the response, not just the denial itself. If a documentation request denial can be answered automatically, the cost to respond drops. That means denials that were previously not worth fighting may now be worth pursuing. A lower-dollar denial that was written off under old economics might be recoverable at scale under new ones.
This also means the denial rate as a standalone metric is even less useful than it was three years ago. What you need to know is denial revenue at risk, recovery rate by payer and denial type, and the cost to respond relative to the expected recovery. Those are three different numbers. Most revenue cycle dashboards report one.
I covered a related version of this problem in my piece on physician practice cash flow — the gap between what shows up on the income statement and what actually lands in the bank account. Denials that are never reworked do not show up as a problem on either report. They just disappear.
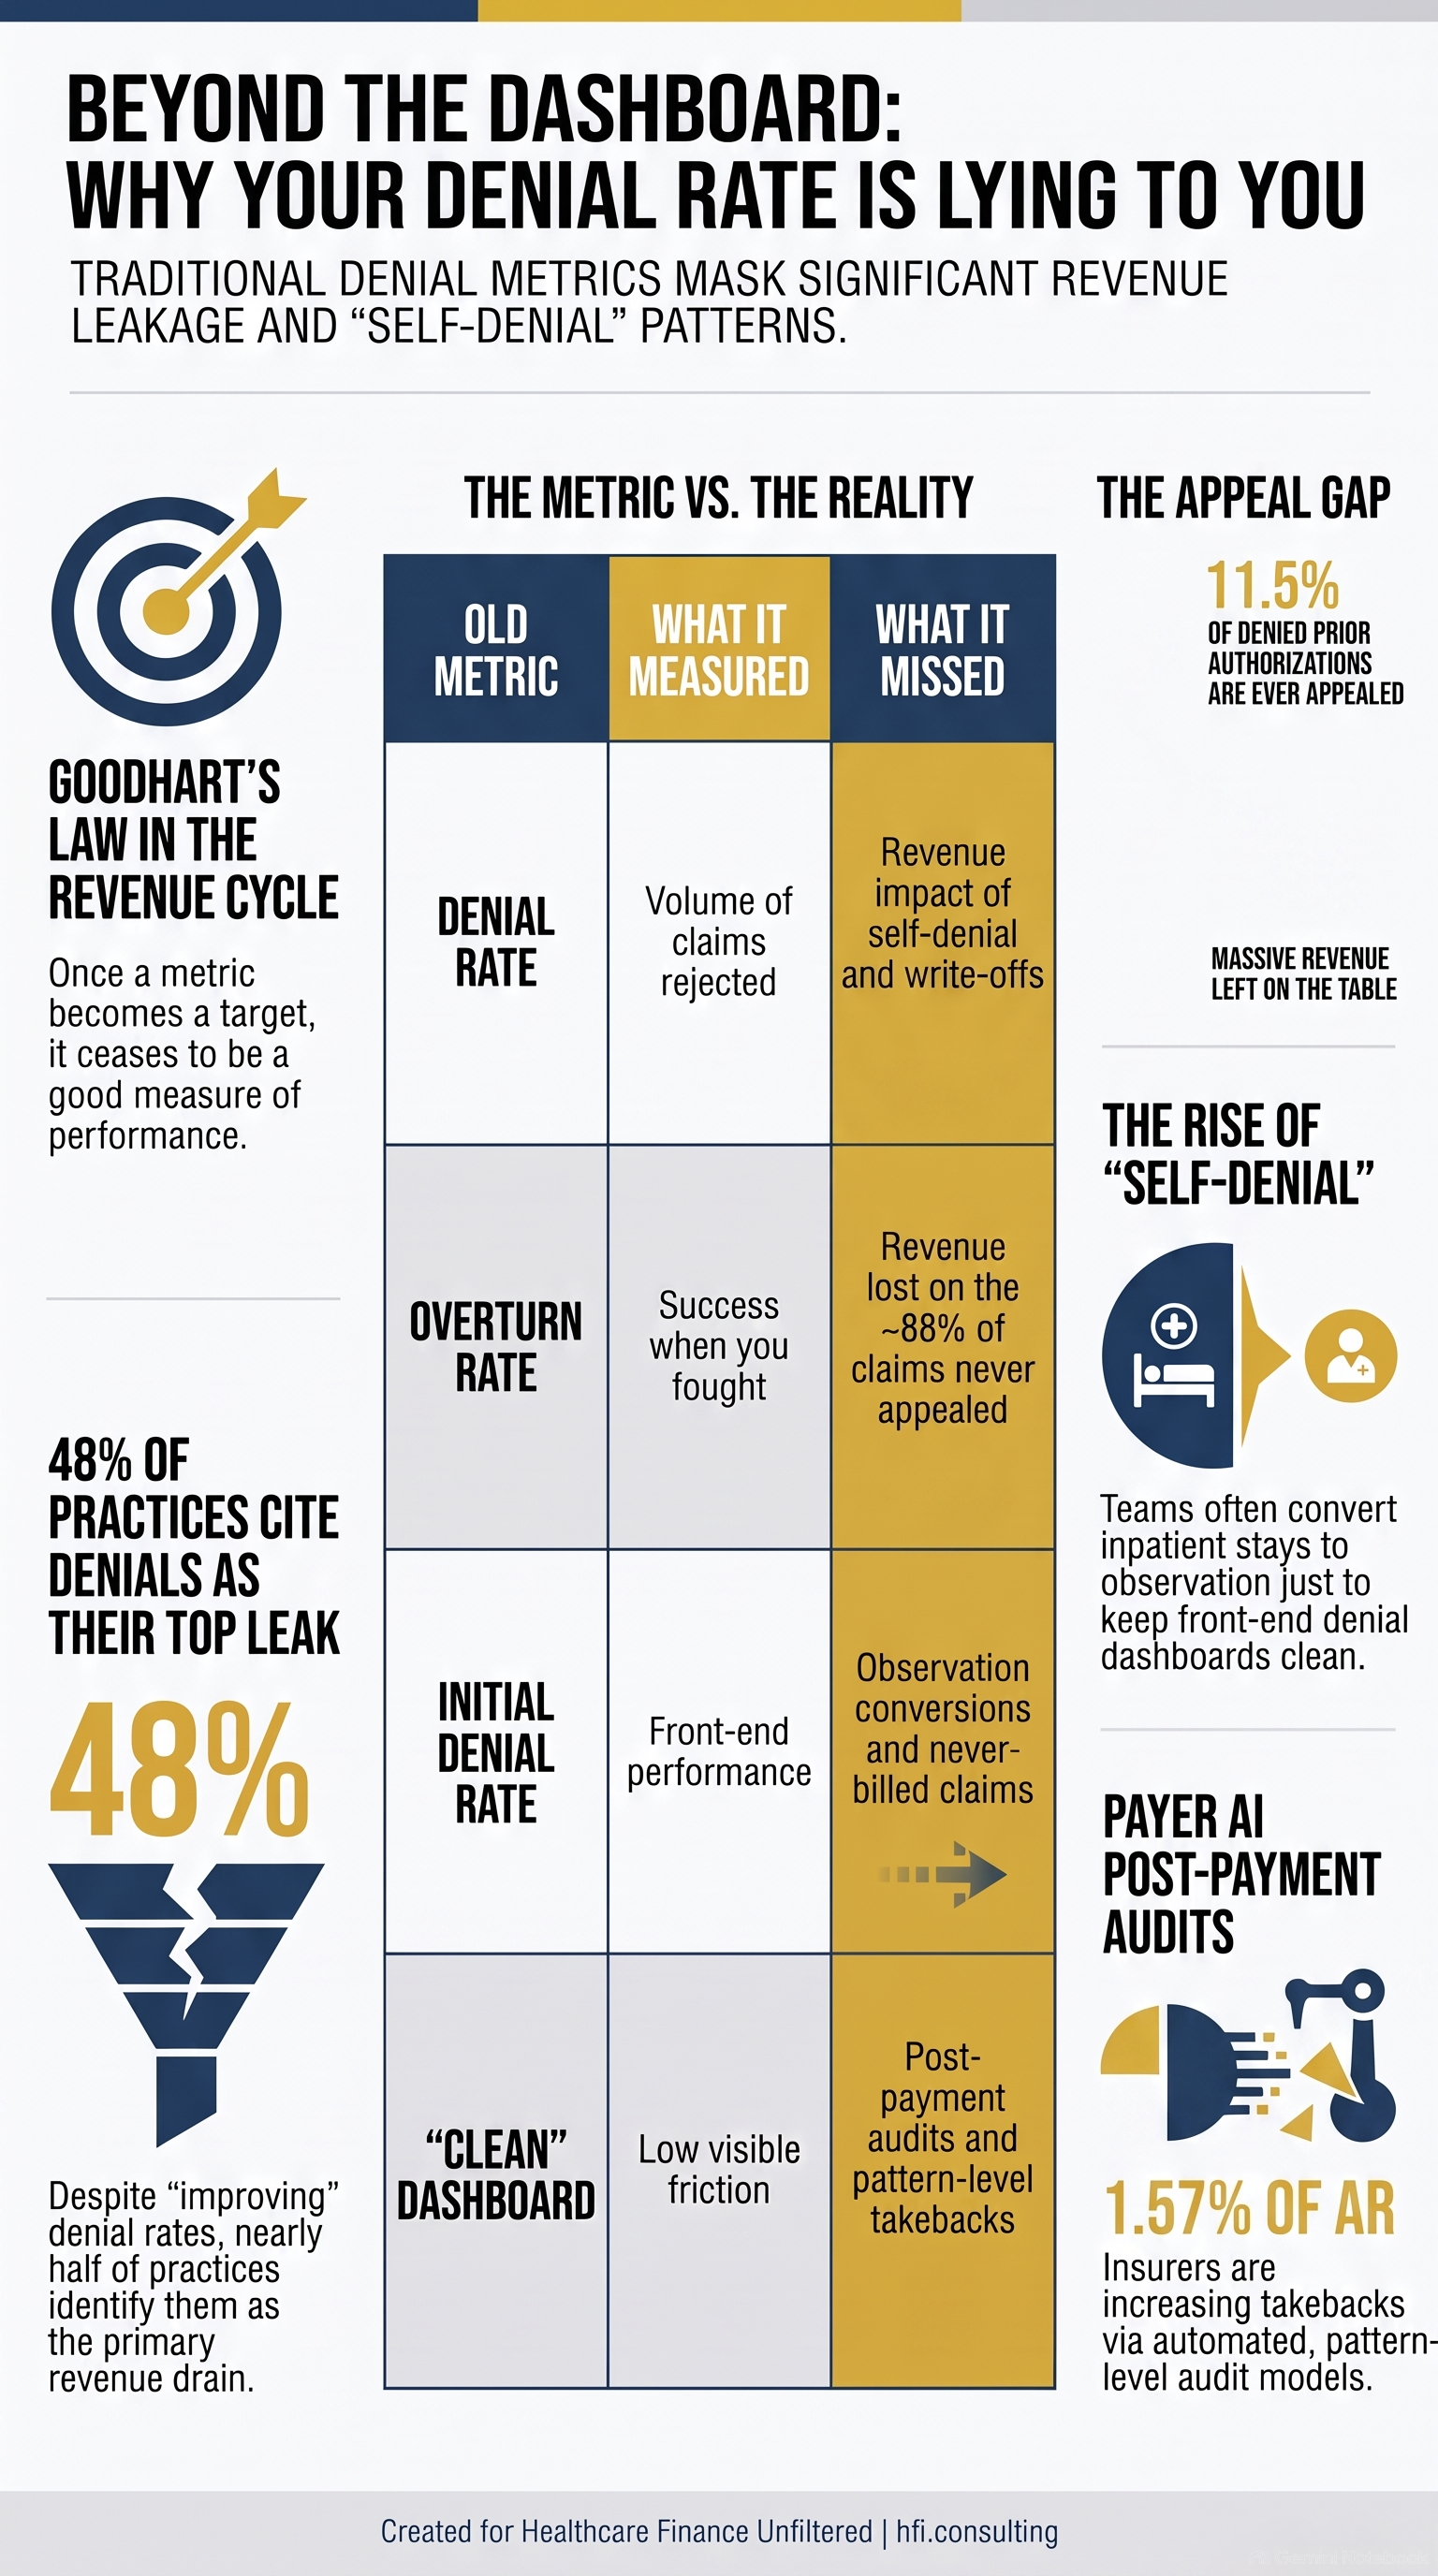
Comparison table contrasting traditional denial metrics with what they actually fail to capture — including self-denial, write-offs, and payer takebacks
What the Fix Actually Looks Like
This is a measurement problem, a workflow problem, and a contracting problem. The fix is not the same for a payer organization as it is for a provider, but there are overlapping principles.
On measurement: Retire denial rate as your primary KPI. Replace it with denial write-offs as a percentage of net patient revenue, dollars recovered per denial category, and appeal volume relative to denial volume. The gap between denials issued and appeals filed is where your leakage lives.
On workflow: Appeal more of the small, repeatable denials — not just the large ones. The payer's business model works when you write off the bottom tier. Build response workflows that specifically target the high-volume, lower-dollar categories where AI response tools can close the gap cheaply.
On documentation: Build clinical documentation to the payer's current policy, not to what a reasonable physician would want to see. Payer AI is matching your notes against dynamic policy text. A chart that was adequate last quarter may not match the criteria the model is checking this quarter. Generic documentation that does not address the specific clinical criteria is the most common reason a clean case fails.
On contracting: If you are a provider, your denial and takeback exposure is at least partly a contracting problem. What your managed care agreements say about prior authorization requirements, timely filing windows, and takeback dispute rights matters. Most BAAs and managed care contracts are silent on the provisions that would protect you when algorithmic audits land.
If you are working through what your current vendor and payer agreements actually say about dispute rights and data audit exposure, the framework I built out in the medical group revenue cycle piece is a useful starting point for organizing that review.
If your revenue cycle team is reporting a denial rate you are proud of but cash flow is not matching the expectation, that gap has a name and it has a fix. HFI Consulting works with physician practices, health systems, and ASCs on revenue cycle diagnostics, chart of accounts alignment, and the financial reporting structure that makes leakage visible before it becomes a write-off. Start the conversation at hfi.consulting.
The Honest CFO Question
From the payer side, I have watched how payers build and run these systems. From the provider side, I have watched finance teams report metrics that looked good while revenue quietly softened. The question I would ask any CFO or Revenue Cycle Director right now is simple:
What is your denial write-off rate as a percentage of net patient revenue? Not the denial rate. The write-off rate.
If you cannot answer that in under 30 seconds, you are managing to get the wrong number.
The MGMA poll that found 48% of practices naming denials as their biggest leak is describing a real problem. The Becker's panel that said chasing a lower denial rate can cost you money is also describing a real problem. They are not contradicting each other. They are describing two ends of the same trap.
The practices and health systems that get out of it are the ones that stop optimizing the metric and start optimizing the revenue.
The denial rate conversation has been stuck in the same place for a decade. AI just made it more complicated on both sides of the table. The organizations that figure this out first will not have better denial rates. They will have better revenue.
If you are ready to look at what your current revenue cycle metrics are actually telling you versus what they are hiding, hfi.consulting is where to start that conversation.
P.S. What is the one revenue cycle metric your team reviews every week that you are least confident actually reflects your real financial performance? Reply and tell me. I read every response.
