
Healthcare Application Complexity: What CFOs Need to Know Before the Next AI Investment
Your systems aren't the problem. The gaps between them are draining your margin.
The average health system runs on more than a dozen core platforms, and that number grows every time a vendor promises to close a care gap. Your peers are adding AI tools, integration layers, and workflow automation at a pace that would have seemed ambitious three years ago. But the budget impact of complexity rarely shows up where you expect it.
The money is not leaking inside your systems. It is leaking between them.
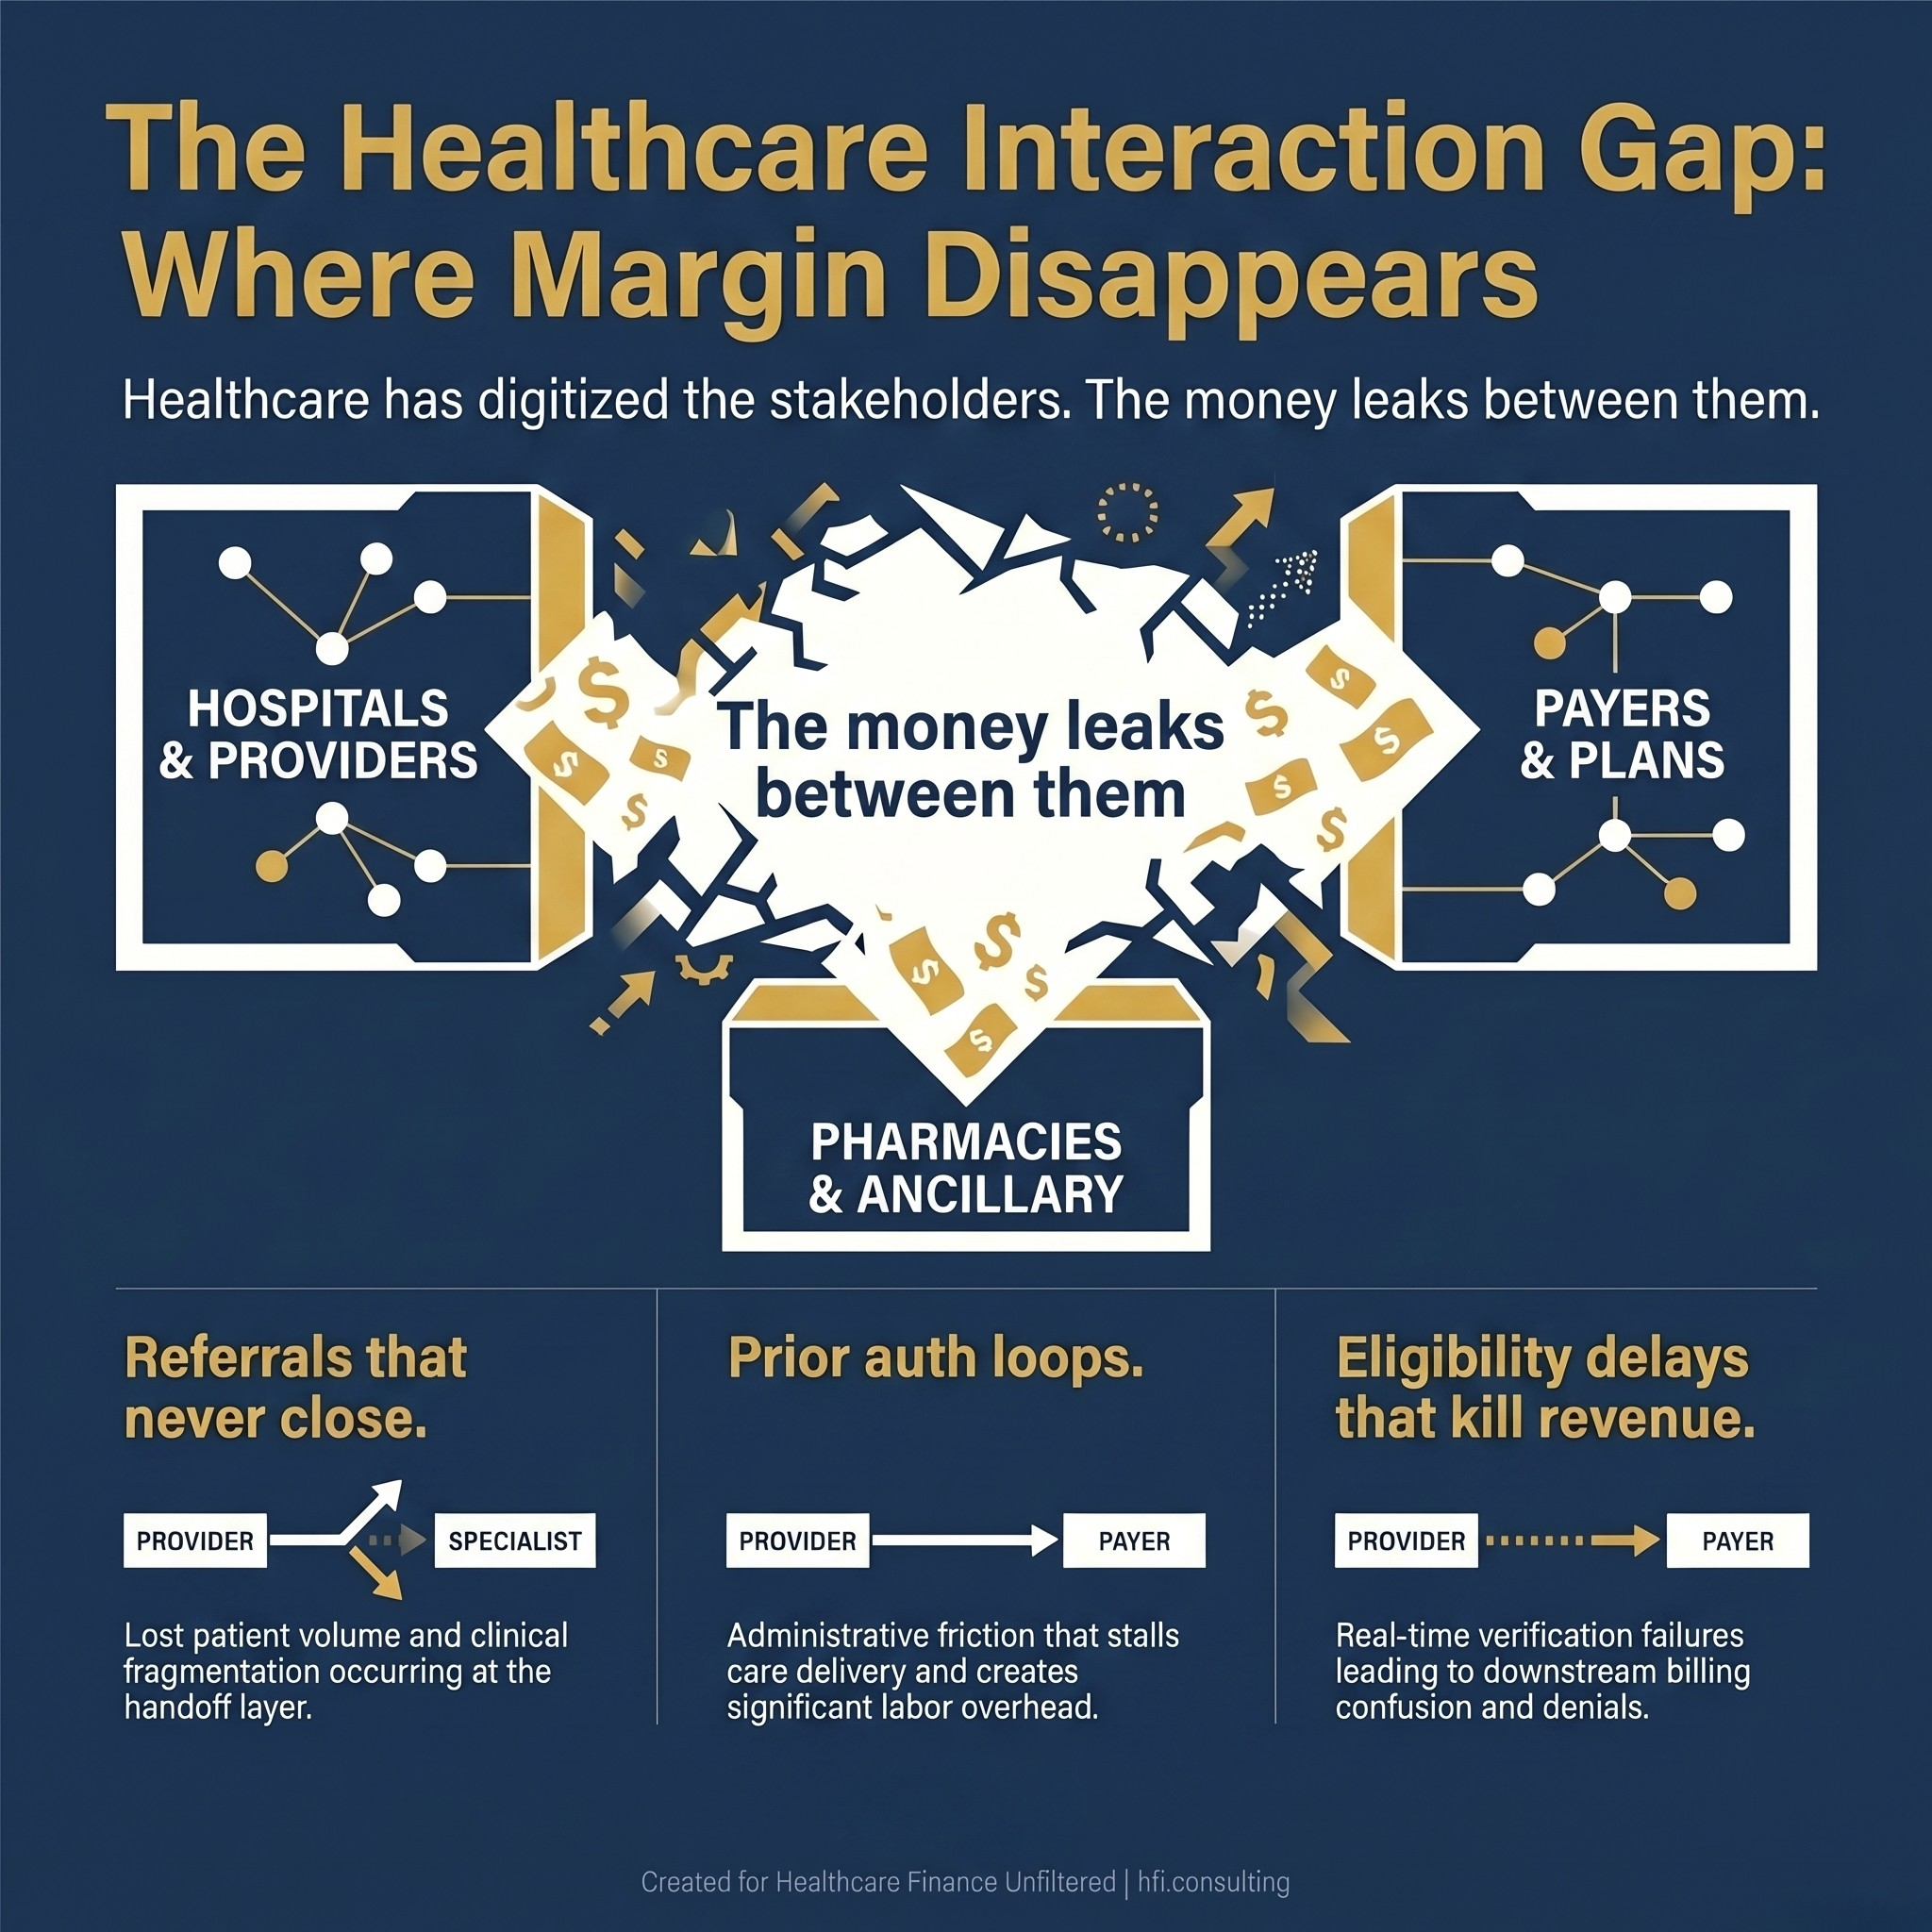
Stat card graphic showing three categories of healthcare revenue leakage occurring at system handoffs: referral failures, prior authorization loops, and eligibility check delays.
The Interaction Layer Problem
A recent viral LinkedIn post by revenue cycle strategist Amol Nirgudkar used a visual that stopped a lot of healthcare finance leaders mid-scroll. The image, developed by Summit, mapped every interaction between the major players in the US healthcare system: care providers, payers, pharmacies, PBMs, employers, and government regulators. Each line on that map represented a transaction, a workflow, and a financial exposure.
The observation that generated the most discussion was not about any single stakeholder. It was about the space between them.
Healthcare has spent twenty years digitizing individual stakeholders. Epic digitized the hospital. Availity digitized eligibility. Claims platforms digitized the payer. But the referrals that never close, the prior auth loops that stall care, the eligibility checks that delay revenue, and the billing confusion that drives denials, those happen in the white space between the platforms. That white space is where your operating margin disappears.
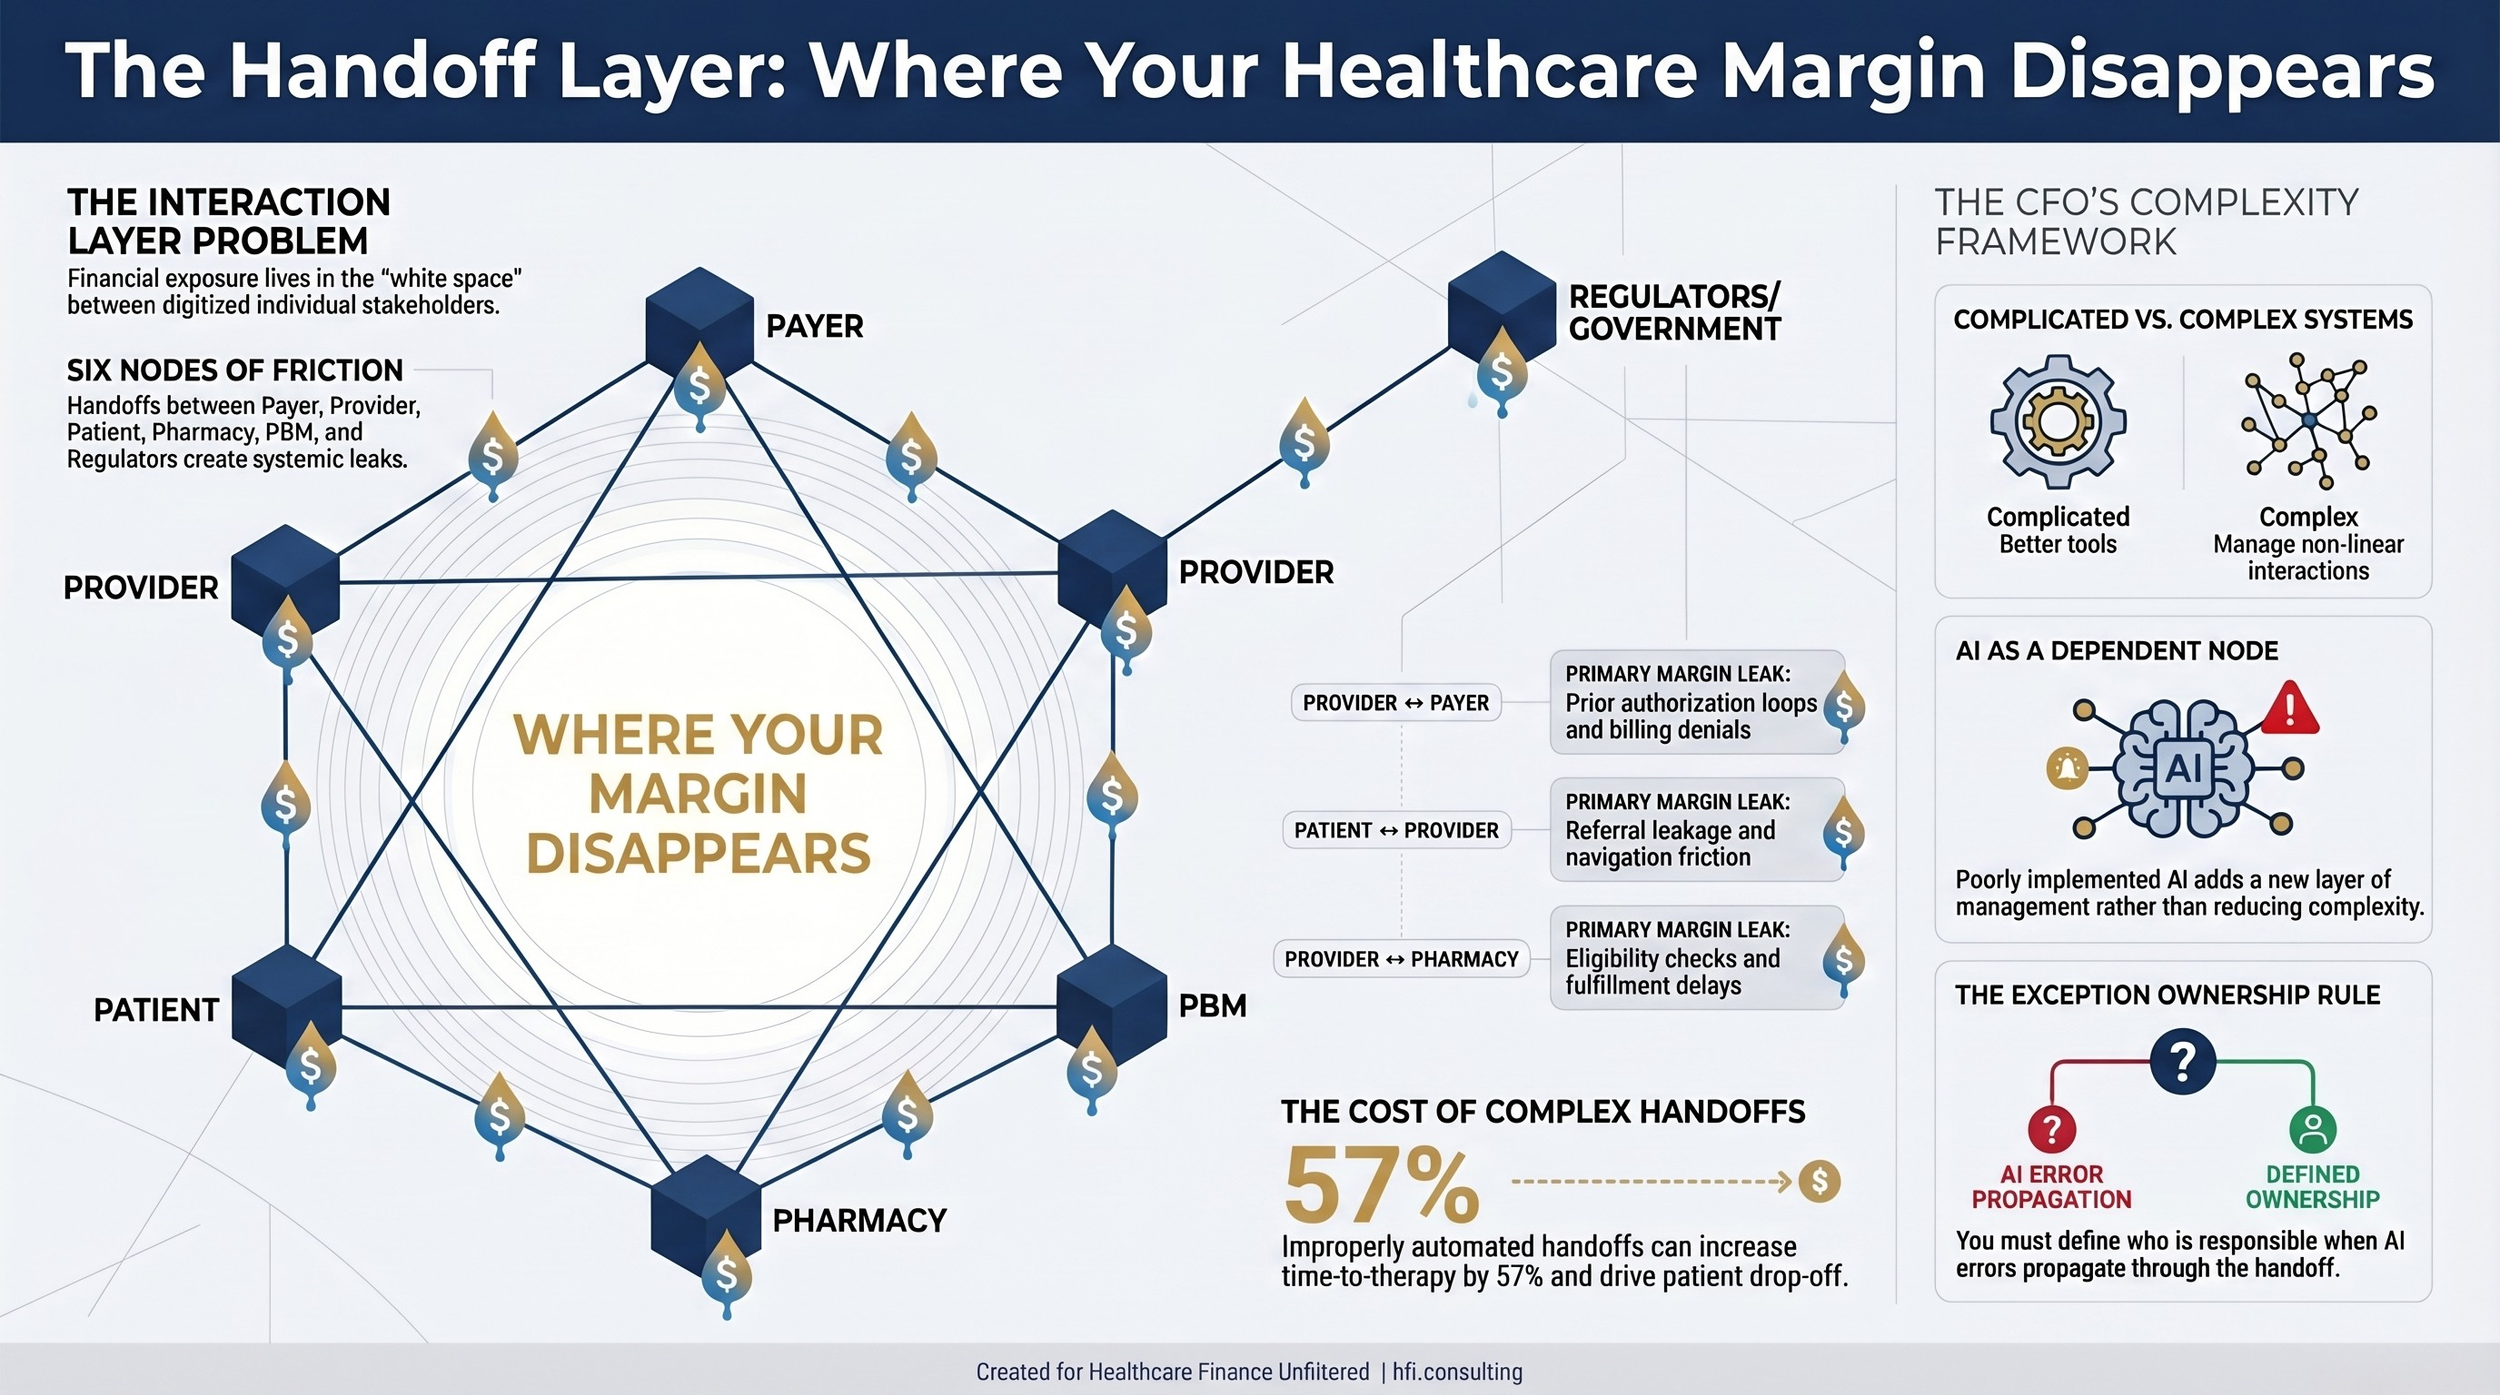
Simplified healthcare stakeholder interaction diagram showing financial friction and margin leakage points at every handoff between payers, providers, patients, pharmacies, PBMs, and government regulators.
A Framework Most Finance Leaders Do Not Use
Complexity science distinguishes between three types of systems: simple, complicated, and complex. Most finance leaders, and the vendors selling to them, treat healthcare as a complicated system, one with many moving parts that can be mapped, optimized, and solved through better tooling.
Complex systems work differently. They are non-linear. They adapt. They produce outcomes you did not predict based on the interaction between agents, not just the individual performance of each component.
Healthcare finance is a complex system. When you change one variable, say, a denial management workflow, you do not just improve denial rates. You shift authorization patterns, affect clinical documentation behavior, change coder workload, and alter the downstream data your payers use to benchmark you. The system responds in ways your implementation plan did not model.
Richard Nason, a complexity researcher at Dalhousie University, has argued that most healthcare administrators manage complex problems with complicated thinking. The result is demand for solutions that do not match the nature of the problem. It is not a criticism of individual leaders. It is a structural gap in how the industry has been trained. For finance leaders, the practical consequence is this: when a vendor promises to eliminate complexity, ask which kind of problem they are actually solving.
What AI Gets Wrong
Artificial intelligence is not inherently good or bad for healthcare system complexity. It depends entirely on what problem the AI is designed to solve and whether that problem should be solved at all.
One of the most pointed observations in the LinkedIn thread around that interaction map came from an AI strategist who worked through a similar exercise for specialty pharmacy operations. He layered in available AI tools to address friction at key handoff points. The result was an increase in time to therapy from 35 to 55 days and a 15 percent drop-off rate. The AI was being used to solve a problem that should have been eliminated, not automated.
This is the first failure mode of AI in complex systems. You identify friction in a handoff, you layer in an AI workflow to manage that friction, and the friction persists while you now also have to manage the AI system, its error rates, its training requirements, and its vendor relationship. You have not reduced complexity. You have added a dependent node.
The second failure mode carries larger strategic implications for both payers and providers.
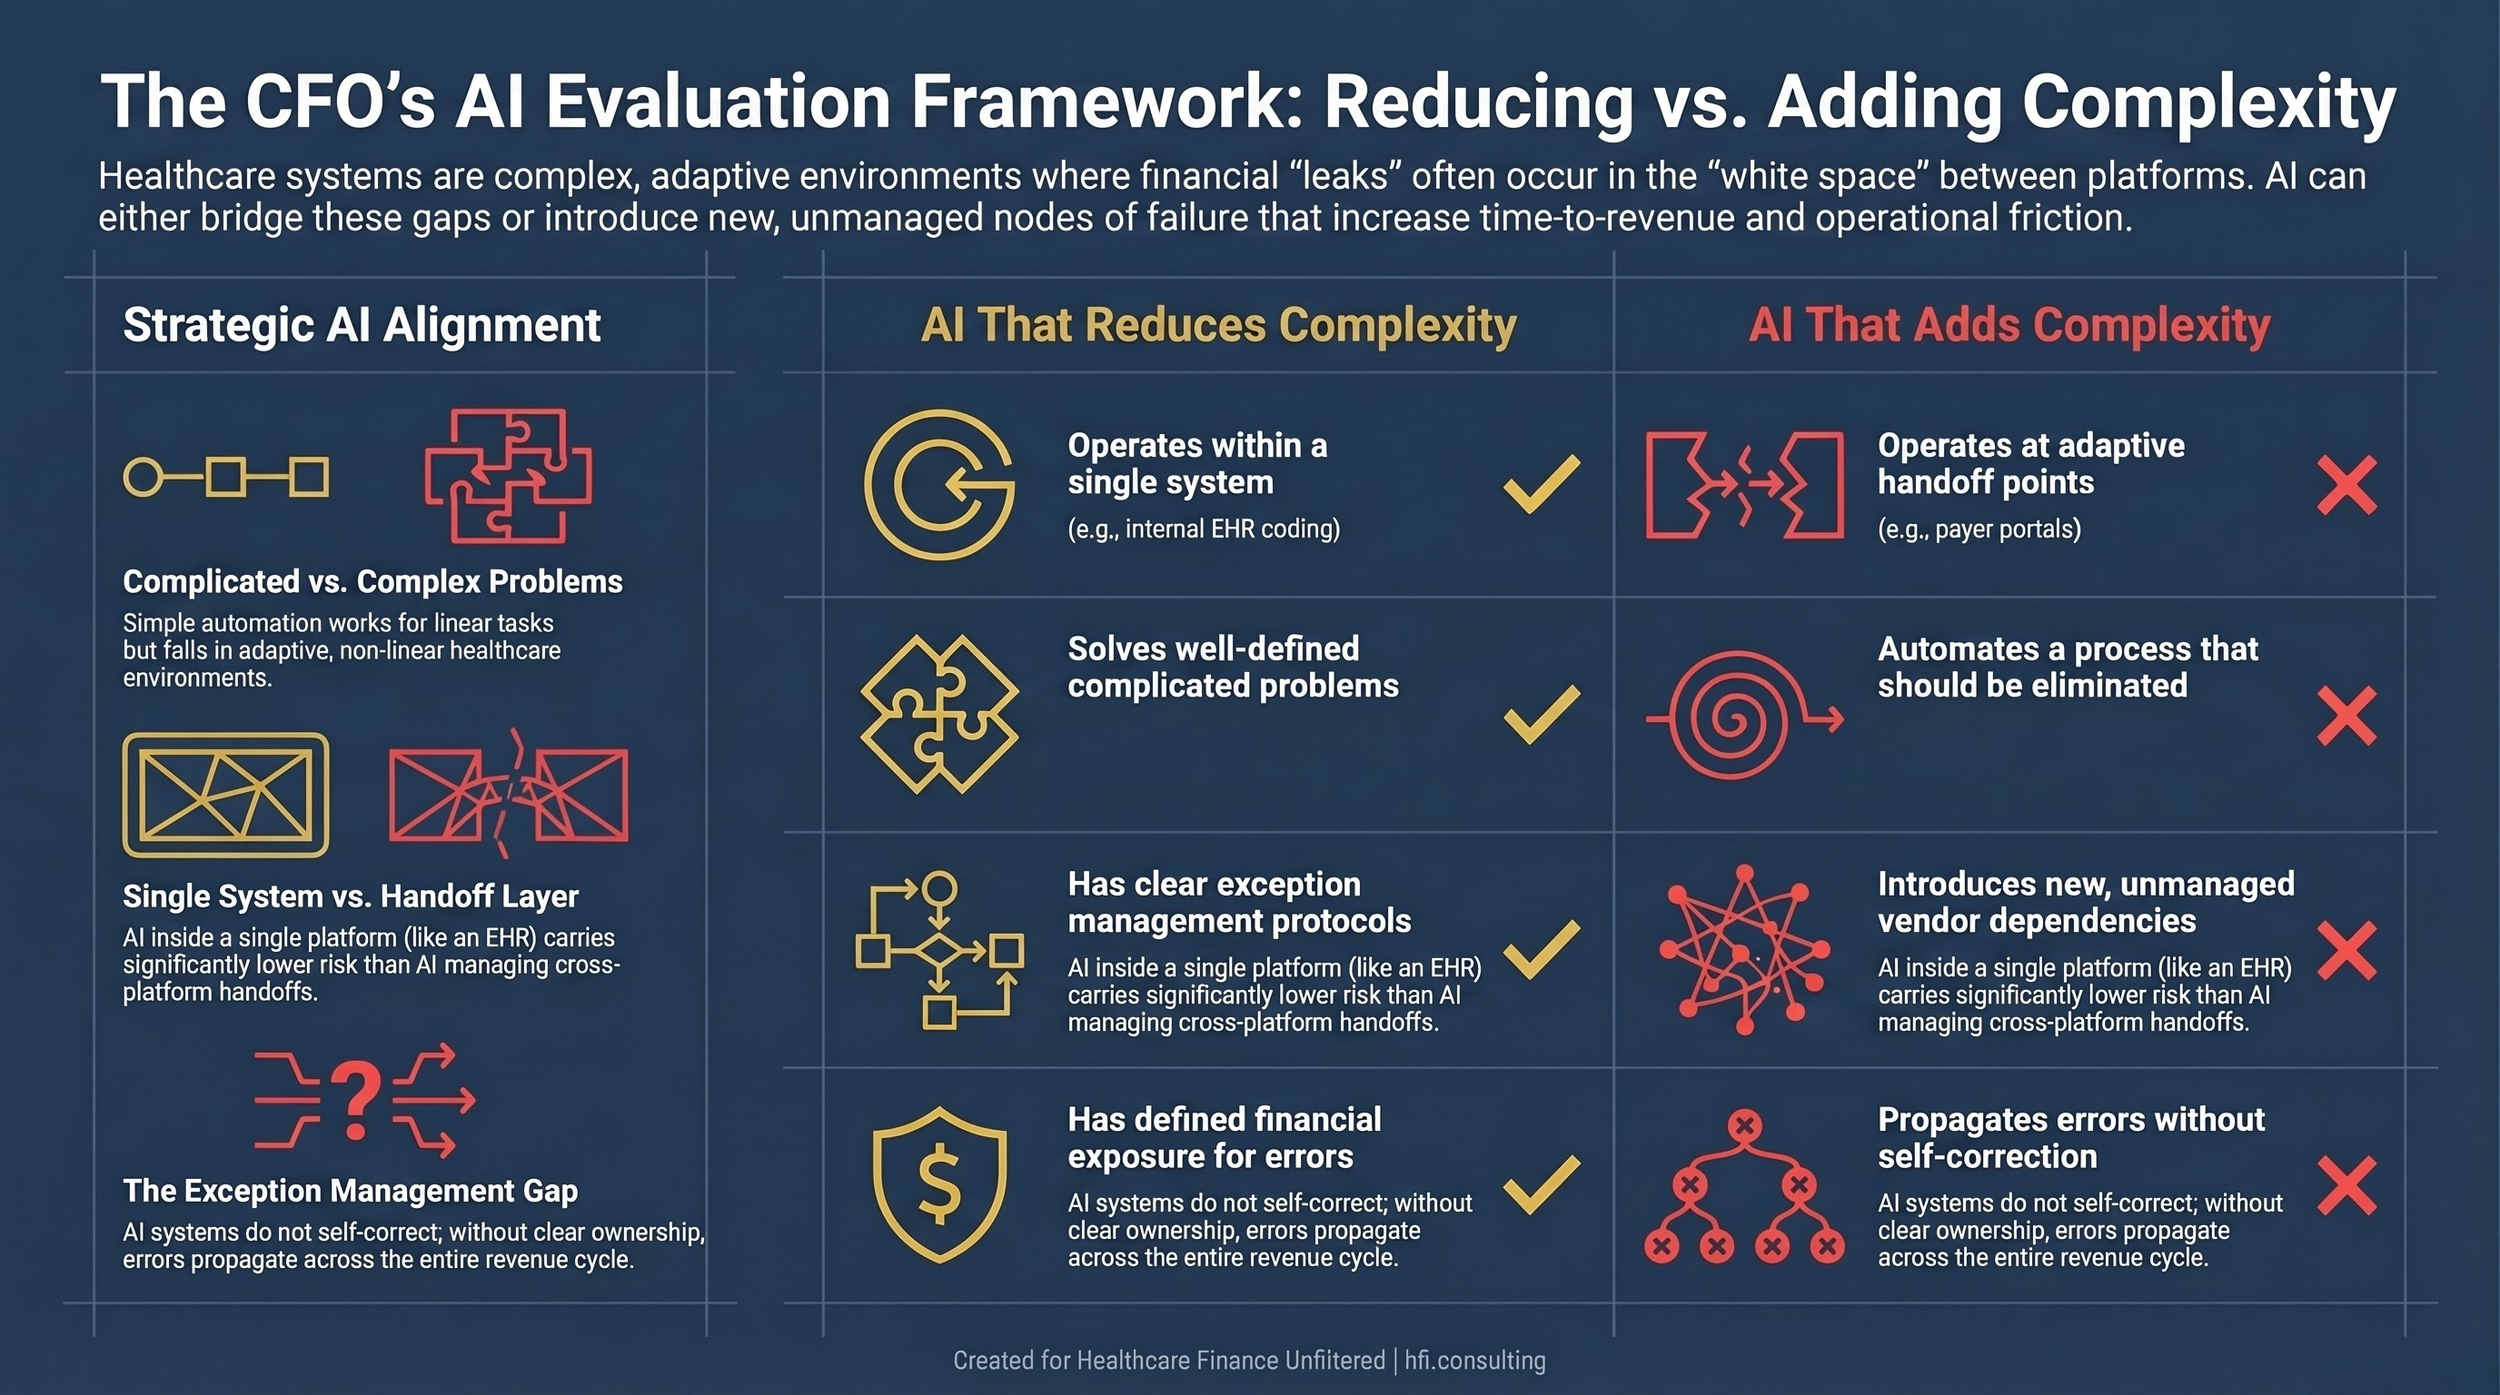
Side-by-side comparison table for healthcare CFOs contrasting characteristics of AI implementations that reduce system complexity versus those that add operational layers to existing friction points.
Healthcare AI strategist Matt Klein pointed out in that same thread that the interaction map was missing one critical line: the handoff from patient to health system that happens before the patient becomes a patient. AI-powered search is already redirecting patients before they enter your referral pipeline. Independent practices are losing patient volume at the top of the funnel and measuring it nowhere in their dashboards.
From the payer side, this matters just as much. At Florida Blue Medicare, I worked closely enough with member engagement patterns to understand how dramatically digital access points shift health-seeking behavior. When members use AI-assisted navigation rather than calling their primary care physician, the downstream utilization pattern changes in ways your actuarial models may not yet reflect. Finance leaders on both sides of the wall need a framework for thinking about AI not just as a workflow tool, but as a stakeholder actively reshaping the interaction map.
The CFO's Advantage in a Complex System
Complexity is not only a threat. It is a competitive moat when you understand it better than your counterparts.
The finance function sits at the intersection of nearly every workflow in your organization. You see data from clinical operations, supply chain, revenue cycle, vendor contracts, and capital planning simultaneously. That cross-functional visibility, which can feel like a burden when you are consolidating reports at month-end, is actually a structural advantage in a complex system. You can see the interaction layer where no one else is looking.
When I was doing financial operations work across Ascension's seven-hospital system, the productivity tracking work across service lines was not just about labor efficiency. It was a diagnostic tool. Variance in productivity often signaled upstream complexity: a documentation workflow adding time, a system integration failing intermittently, a scheduling pattern creating downstream bottlenecks. The numbers pointed to the white space. CFOs who treat their data as a complexity map, not just a performance report, will be better positioned to evaluate which AI investments actually reduce operational friction and which ones add a new layer to it.
A Practical Evaluation Framework
Before your next AI vendor conversation, run any proposed solution through three questions.
Is this solving a complicated problem or a complex one?
Complicated problems respond to better tools. A complex problem, one involving multiple adaptive agents changing behavior in response to each other, requires a different kind of intervention. Automating a prior auth submission does not solve a prior auth complexity problem if payers are adapting their criteria faster than your system can learn.
Where does this tool sit on the interaction map?
AI that operates within a single system, improving coding accuracy inside your EHR for example, carries lower integration risk. AI that operates at the handoff layer, between your system and a payer portal or between your scheduling platform and a patient navigation tool, introduces new dependencies your IT and legal teams need to evaluate before go-live.
Who owns the exception?
Every AI system produces errors. In complex healthcare environments, those errors do not self-correct. They propagate. Before you sign a contract, you need a clear answer to who is responsible for identifying and resolving the output your AI gets wrong, what the remediation workflow looks like, and what the financial exposure is when the exception involves a claim, a prior auth, or a patient safety event.
If you want a practical tool for running AI vendor proposals through these three criteria, I built a framework workbook that walks through each dimension with scoring criteria and contract red flag language. Reply to this email and I will send it directly.
The Strategic Bet Finance Leaders Should Make
Healthcare will continue adding applications. The interaction map will continue to grow. The finance leaders who build institutional capacity to map, measure, and manage the handoff layer will be the ones with a defensible margin in five years.
That is not primarily a technology investment. It is an analytical investment. It requires your team to ask different questions about your data, your vendor contracts, and your operational reports. It requires you to treat complexity as a measurable phenomenon rather than an organizational complaint.
The vendors pitching you AI are right that the handoff layer is where the value is. They are not always right about what it takes to capture it.
For more on how revenue cycle AI is reshaping these handoffs in real time, the AI-powered revenue leakage prevention breakdown I published earlier this year lays out the specific operational mechanics.
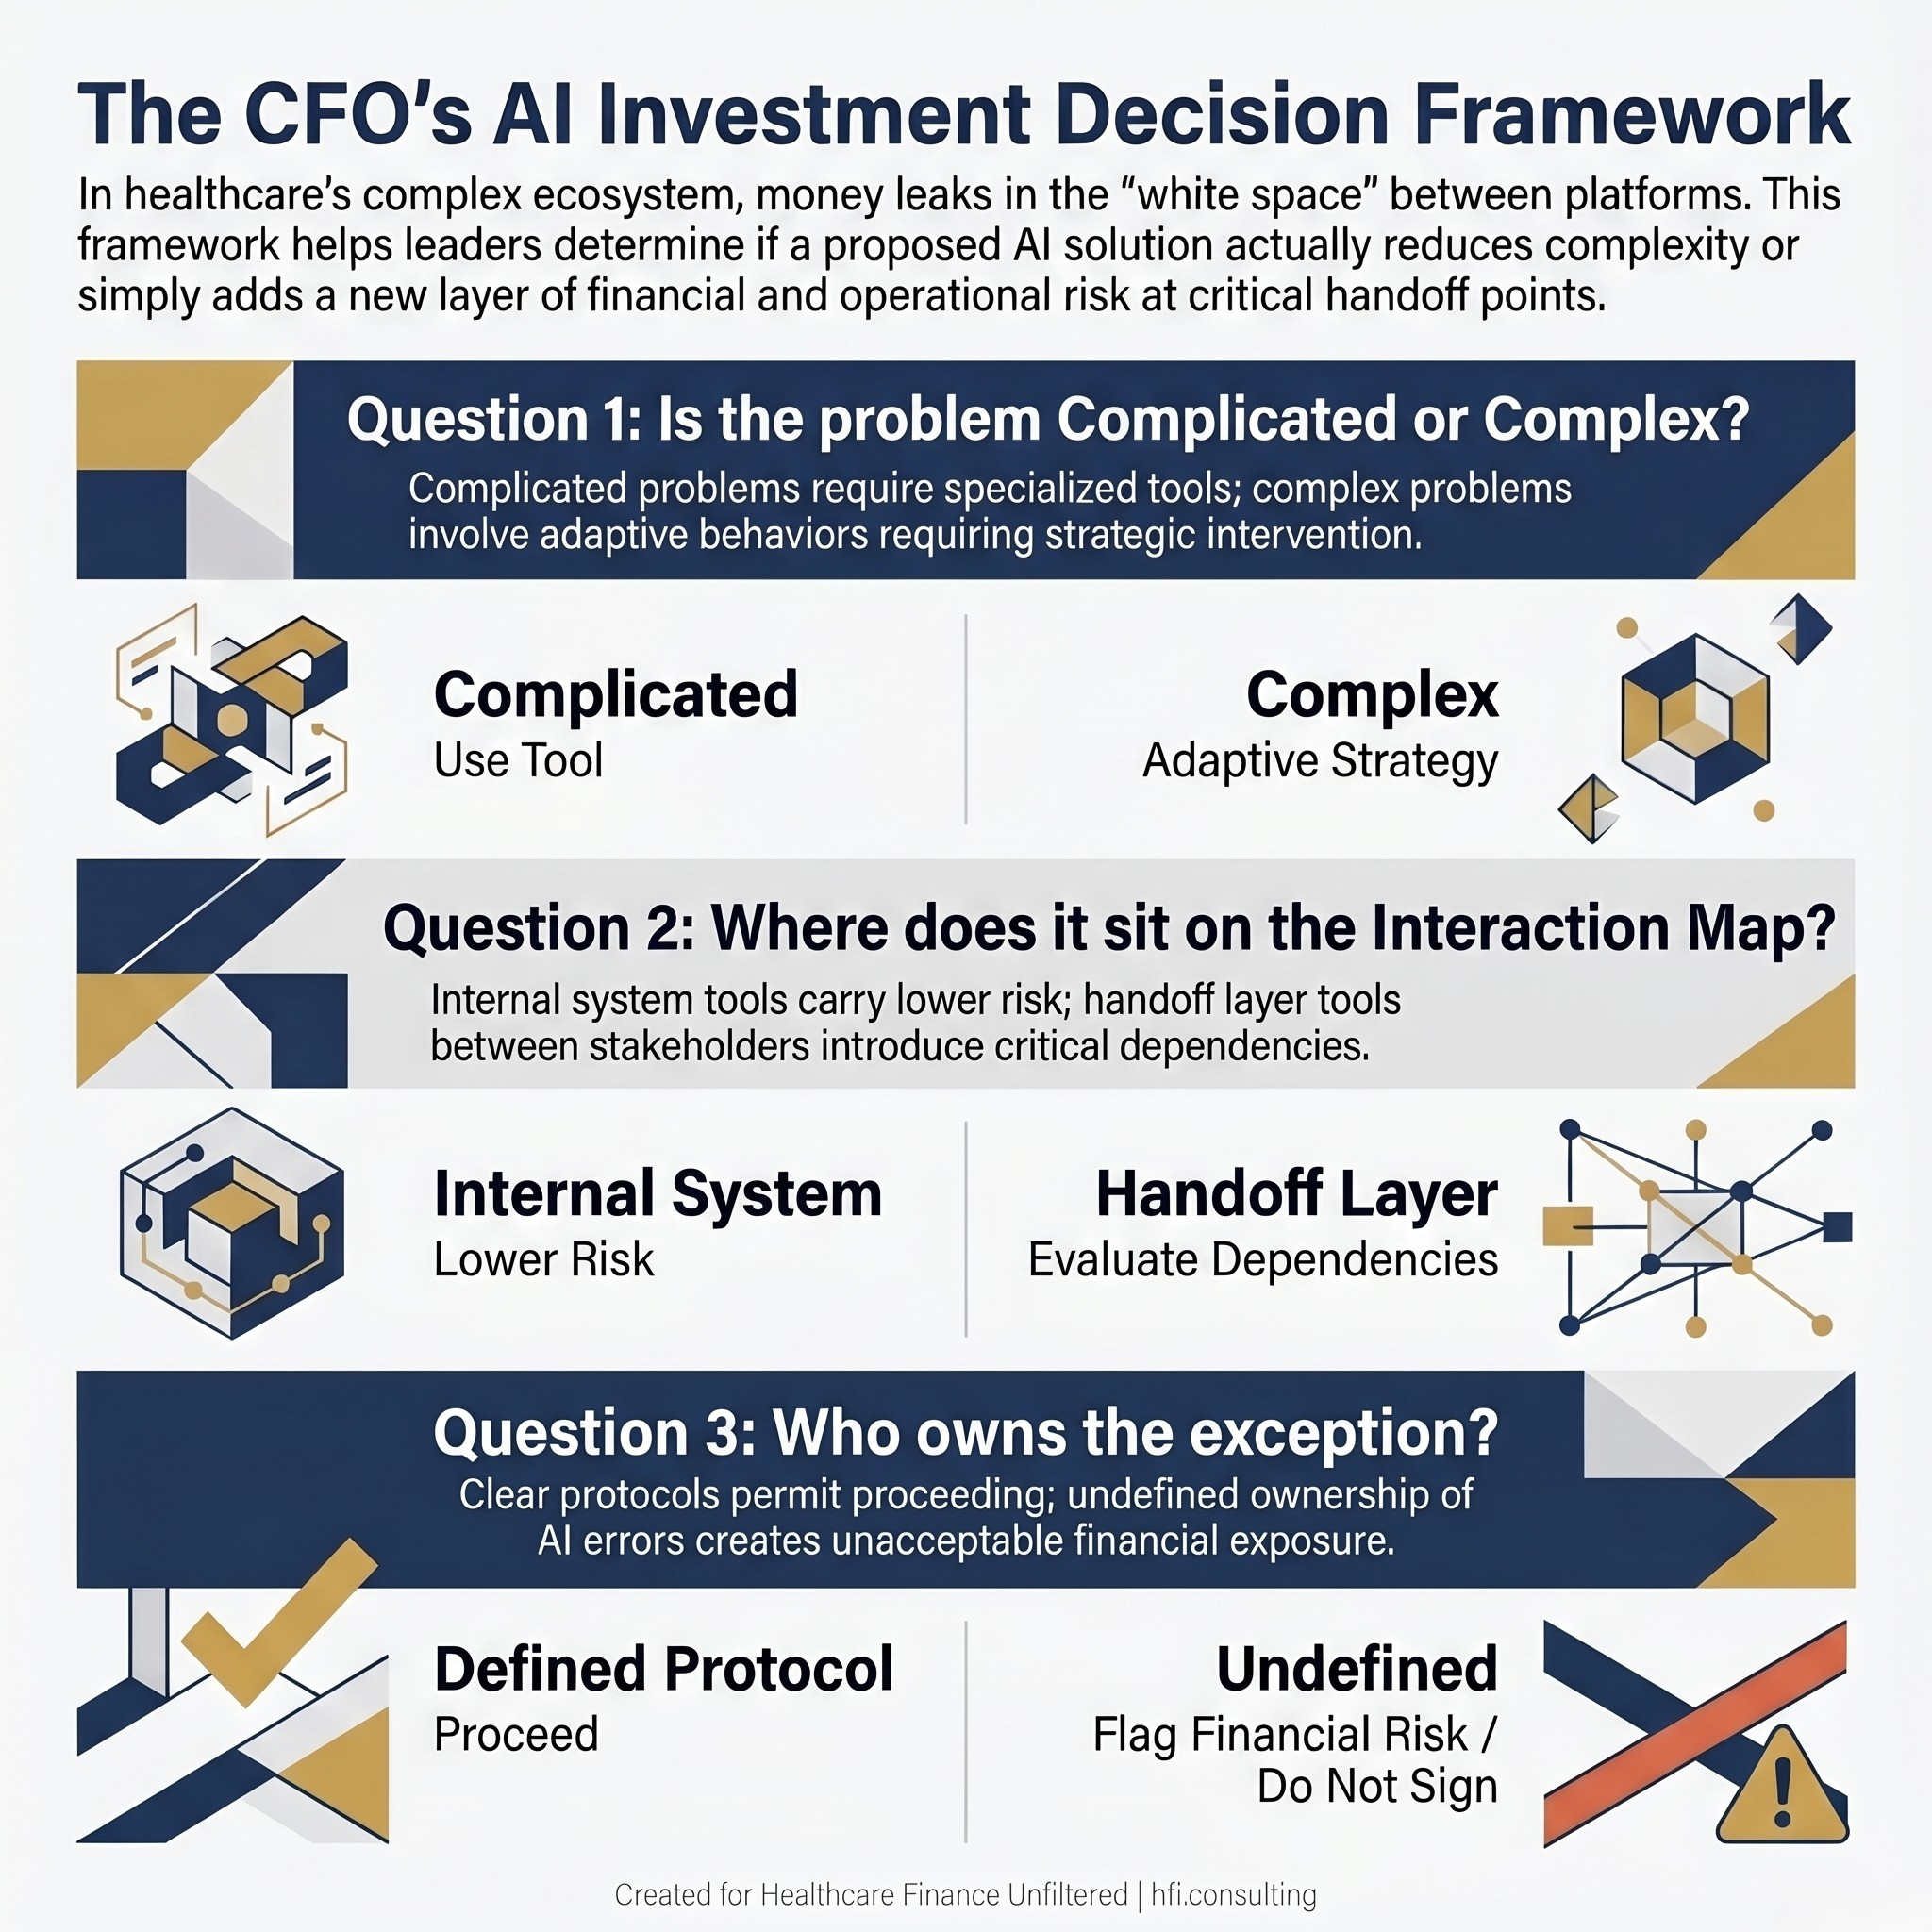
Three-question CFO decision flowchart for evaluating healthcare AI vendor proposals, covering problem type classification, interaction map positioning, and exception management ownership with financial risk indicators.
P.S. Where is your organization's interaction complexity highest right now: the payer-provider handoff, the patient-to-system entry point, or somewhere inside your own application stack? Hit reply and tell me. I am tracking patterns across reader responses and it is shaping my next analysis.